Stock Market Looming Danger Signs, and 2 Amazing Opportunities
Stock-Markets / Stock Markets 2011 Jan 12, 2011 - 07:37 AM GMTBy: Claus_Vogt
 Rarely have I seen a greater dichotomy between the dangers looming for traditional investments and the amazing opportunities in a wide variety of alternative investments!
But first let’s talk about the three immediate danger signs:
Danger Sign #1 A Major New Debt Crisis Striking Thousands of Local Governments Throughout the United States
This debt crisis is very different from the sovereign debt crisis we warned you about last year, which struck Greece and Ireland … and is now hitting Portugal and Spain.
Why is it so different? Think about it …
In prior debt crises a major central government or bank came to the rescue. This time …
- The Federal Reserve has neither the authority nor the will to come to the rescue; and
- The U.S. Congress is even less inclined to open the Pandora’s box that a city or state bailout would involve.
In the European debt crisis, it was far away for most Americans. This one is striking at the very heart of the U.S. economy!
Result: A big threat to U.S. GDP growth in the second quarter AND to the U.S. credit markets at the same time.
Danger Sign #2 A Major Divergence in the Stock Market In last week’s Money and Markets column, I explained why I rate the current stock market environment as extremely risky.
Now, let me elaborate on a key indicator that confirms and double-confirms that view: The number of stocks hitting 52-week highs.
This number is reported daily for the New York Stock Exchange (NYSE) and other exchanges. And it contains valuable information on the overall condition of the U.S. stock market …
- During a healthy, durable bull market, as the major indices move to new highs, there should be an increase in the number of stocks making new highs, as a growing number of issues participate. And for the rally to continue, stocks must repeatedly hit new cyclical highs. But …
- At the tail end of a bull market, this picture starts to change. The breadth of the move weakens. More and more stocks enter topping formations or start to roll over. And the number of stocks making 52-week highs levels off or actually declines.
That’s precisely the picture I see now: Although the broad indices are still making new highs, fewer stocks are doing so. In other words …
The whole rally now depends on a shrinking number of stocks!
That’s what technicians call a “negative divergence” — a broad market index like the S&P 500 makes new cyclical highs, but a key indicator like this one fails to do so, or even goes the OTHER way.
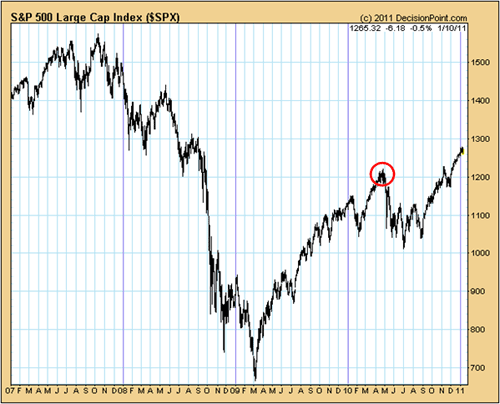
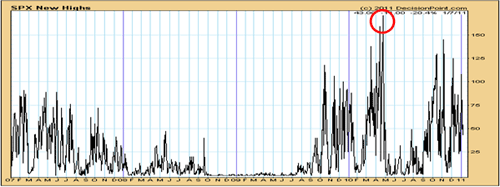
For the evidence, look at the chart below. It shows the S&P 500 since 2007 and, in the lower panel, the number of its component stocks hitting 52-week highs. As you can see, the current move to new index highs is not confirmed by the number of 52-week highs.


The indicator’s high for the current cycle was way back in April 2010. So the market is actually showing multiple negative divergences: A succession of higher highs in the index and … at the same time … a succession of lower highs in this indicator.
This is a double- and triple-warning sign that the U.S. stock market is on weak footing.
And the number of 52-week highs is a time-honored indicator. Historically it has often given important warning signs well before a major bear market commenced. Just look at 2007 and you’ll see an example of a negative divergence similar to the one we’re experiencing now!
Danger Sign #3 Great Overvaluation
Fundamentals are the long-term driver of all markets, whereas technicals are the tools to get additional perspectives of what is going on.
And right now, traditional valuation metrics — such as dividend yield, price/earnings ratios, and others lead to the same conclusion:
The U.S. stock market is severely overvalued … possibly by 50 percent or more!
No, valuation measures don’t help you pinpoint exactly when the next bear market will begin. As long as other major drivers like money supply and investor sentiment are mainly bullish, a rally CAN continue … no matter how expensive the market has become.
But the fact is that since August of last year …
- The debt crisis in cities and states has deteriorated rapidly
- Interest rates have risen strongly
- Sentiment indicators are showing too much investor complacency, and as I explained above
- Technical indicators, including the 52-week highs, are also in the danger zone.
Taken together this adds up to a very dangerous picture. Now let me tell you about the great profit opportunities this generates …
First, you have an opportunity to profit from the decline itself. I mentioned the ProShares Short S&P 500 (SH) last week. Another idea is the ProShares Short QQQ (PSQ).
This ETF seeks daily investment results, before fees and expenses, that correspond to the inverse of the daily performance of the NASDAQ-100 Index. So the more these decline, the more you stand to make.
Second, you can profit from the government’s overblown response to the dangers.
You see, Washington — along with governments here in Europe — have the power to pour trillions of dollars into the economy. But they do not have the power to tell global investors where to put that money.
All that money has to go SOMEWHERE and it is flooding into investments that naturally — and almost inevitably — rise in this environment.
Best wishes,
Claus
This investment news is brought to you by Money and Markets. Money and Markets is a free daily investment newsletter from Martin D. Weiss and Weiss Research analysts offering the latest investing news and financial insights for the stock market, including tips and advice on investing in gold, energy and oil. Dr. Weiss is a leader in the fields of investing, interest rates, financial safety and economic forecasting. To view archives or subscribe, visit http://www.moneyandmarkets.com.
© 2005-2022 http://www.MarketOracle.co.uk - The Market Oracle is a FREE Daily Financial Markets Analysis & Forecasting online publication.


