


$536 Billion Worth of Household Assets Evaporated in February?
Economics / US Housing Apr 30, 2008 - 10:06 AM GMTBy: Paul_L_Kasriel
 It sure is a good thing that $150 billion of checks from the IRS are in the mail to U.S. households because these same households experienced an evaporation in paper wealth in February to the tune of about $544 billion according to my admittedly back-of-the-envelope arithmetic. It was reported today that the Case-Shiller house price index for 20 major metropolitan areas fell 2.66% month-to-month in February. Applying that percentage decline in house prices to the fourthquarter value of $20,154.7 billion for household residential real estate from the Fed’s flow-offunds data yields a decline of $536 billion. Now, this is a very rough approximation for at least two reasons.
Firstly, the Case-Shiller price index is for only 20 metropolitan areas, not the whole country. So, the Case-Shiller index captures the decline in house prices in the Manhattan, New York area but not the Manhattan, Kansas area. Second, the value of residential real estate in the Fed’s flow-of-funds accounts is based on the OFHEO house price index. But even with these qualifications, I feel confident in saying that the value of households’ residential real estate assets fell in February by some multiple of the aggregate value of the checks households will receive as part of the Economic Stimulus Act of 2008.
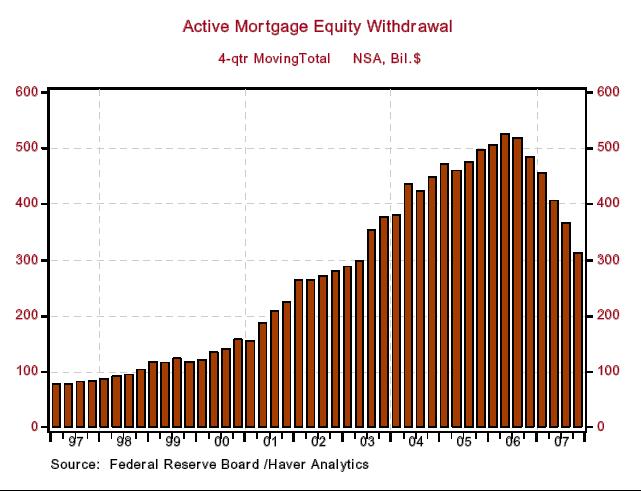
Of course, the check from the IRS is cash in hand and the decline in the value of residential real estate is a “paper” loss. But when residential real estate values were going up, households were turning these “paper” gains into cash in hand by borrowing against the rising value of their houses. Back in 2006, households were extracting more than $500 billion of equity from their houses (see chart below), which was about 6% of their after-tax income. That home equity is now in full-scale retreat. Moreover, it is tougher to qualify for a mortgage or home equity loan with which to extract any remaining equity. This is one of the strong headwinds aggregate demand is experiencing now.
(Note: This commentary was motivated by a conversation I had with Michael Nicoletti, a renowned student of the housing market, this morning. Any errors in analysis or arithmetic are mine, not his.)
By Paul L. Kasriel
The Northern Trust Company
Economic Research Department - Daily Global Commentary
Copyright © 2007 Paul Kasriel
Paul joined the economic research unit of The Northern Trust Company in 1986 as Vice President and Economist, being named Senior Vice President and Director of Economic Research in 2000. His economic and interest rate forecasts are used both internally and by clients. The accuracy of the Economic Research Department's forecasts has consistently been highly-ranked in the Blue Chip survey of about 50 forecasters over the years. To that point, Paul received the prestigious 2006 Lawrence R. Klein Award for having the most accurate economic forecast among the Blue Chip survey participants for the years 2002 through 2005.
The opinions expressed herein are those of the author and do not necessarily represent the views of The Northern Trust Company. The Northern Trust Company does not warrant the accuracy or completeness of information contained herein, such information is subject to change and is not intended to influence your investment decisions.
Paul L. Kasriel Archive |
© 2005-2022 http://www.MarketOracle.co.uk - The Market Oracle is a FREE Daily Financial Markets Analysis & Forecasting online publication.