


10 Things That Affect Your Purchasing Power
Economics / Inflation Sep 24, 2014 - 06:32 PM GMTBy: Harry_Dent

 Rodney Johnson writes: This might be considered “wonkish,” but it tells the story of how middle-class purchasing power has suffered since 2007.
Recently, the Federal Reserve released the 2013 Survey of Consumer Finances (SCF). This tri-annual survey is a treasure trove of information that provides a snapshot into the financial life of the median American in inflation-adjusted 2013 dollars. Notice that I said “median” and not “average”… that’s important.
The average can be skewed by a few people at the top or bottom of any measurement. The median gives us the point at which half the people are above and half the people are below and is a much better indicator of what’s going on. Because the SCF has been conducted for decades, we can see how people have progressed, or regressed, over time.
The changes over the last six years are consistently horrible, particularly for those in the middle income brackets.
10 Factors That Affect Your Purchasing Power
- Age of Head of Household
- Percentile of Income
- Family Structure
- Education of Head of Household
- Race of Head of Household
- Current Work Status of Respondent
- Region
- Urbanicity
- Housing Status
- Percentile of Net Worth
Since 2007, median net worth has tanked, almost any way you cut it. The one group that escaped a decline was the Current Work Status of “other,” whose median net worth in 2007 was $6,000, and in 2013 was $9,000. Yes, I know… fat cats on Wall Street and corporate executives are raking in ridiculous sums of money, so there must be small pockets of people that have seen their fortunes rise over the past six years. These groups are so small that they exist at the edges of society.
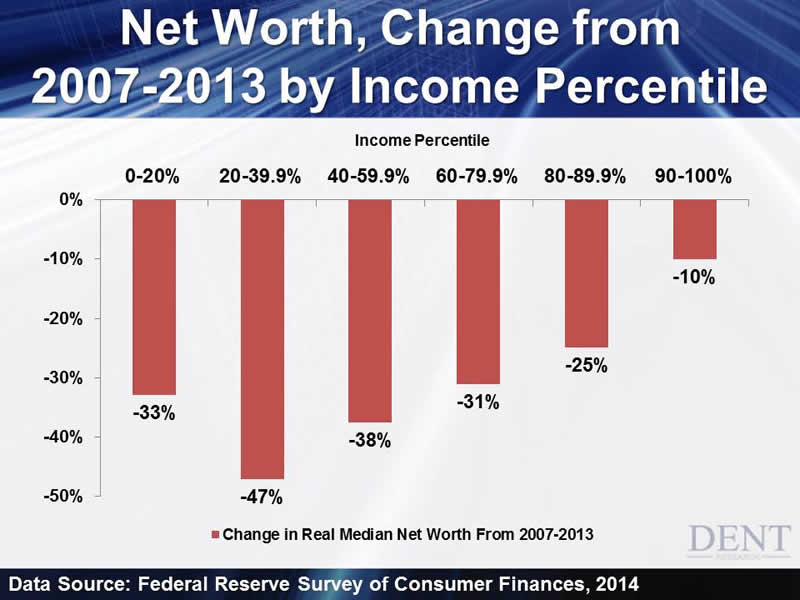
For the median person, the one in the exact middle in all of these categories except the one, it’s nothing but losses. Looking at just one classification — net worth by percentile of income — the change in median net worth from 2007 to 2013 is breathtaking.
When we flip over to the change in median income itself, the results are still miserable, though not as dramatic. Almost every group in every category suffered a decline in income over the past six years. The exceptions were households led by those over 65 years old, households of retirees, and those with net worth in the 90% to 100% range. Again, breaking it out by percentile of income, there were losses in every group.
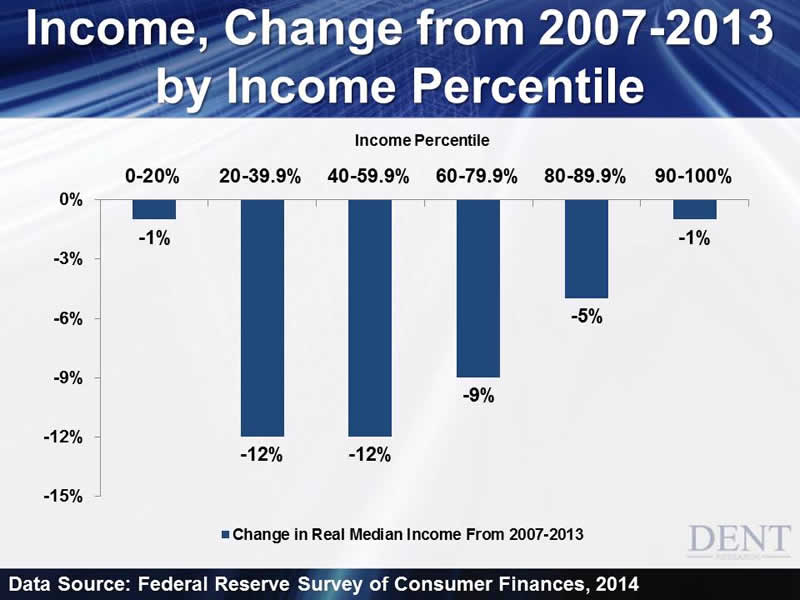
While the median at the bottom and the top of the food chain experienced little change in inflation-adjusted earnings over the past six years, those in the middle income and just below were hit hard.
Now, think of these two statistics together. For those who earn between the 40th and 59.9th percentile of earnings, meaning those smack in the middle of wages in the U.S., purchasing power has fallen by 12% while their net worth has plummeted by 38%… and that’s over SIX YEARS!
This isn’t a one-year aberration, or some fluke in the data. This is six years.
Where is the recovery? Where is the improving economy that is supposed to carry the U.S. through the second half of the 2010s? How are people supposed to not only grow their purchasing power, but also put money away for their future?
Keep in mind that the inflation numbers used to adjust the data are the official Consumer Price Index (CPI) figures. If we used more realistic numbers over those same six years, showing higher spending on medical expenses, education and food, the reports would be even worse.
Whenever you read about the recovery gaining speed, or about consumers gearing up for higher spending, think about these numbers. Think about the millions of Americans who can’t even tread water financially, and have watched their situation deteriorate for more than five years. These are not high school dropouts, or even just high school graduates (only 35% of Americans have a college degree, so by definition 50% of earners must include many college grads).
Think about them when someone at the Fed, in Congress, in the Administration or at the New York Times crows about how they “saved” us.
The line between the “haves” and the “have-nots” is being drawn more boldly with each passing year. At some point, the angry “have-nots” might choose to stand up and start saving themselves. This should make the small group at the top very nervous.
Rodney
Follow me on Twitter @RJHSDent
Rodney Johnson
Rodney Johnson works closely with Harry Dent to study how people spend their money as they go through predictable stages of life, how that spending drives our economy and how you can use this information to invest successfully in any market. Rodney began his career in financial services on Wall Street in the 1980s with Thomson McKinnon and then Prudential Securities. He started working on projects with Harry in the mid-1990s. He’s a regular guest on several radio programs such as America’s Wealth Management, Savvy Investor Radio, and has been featured on CNBC, Fox News and Fox Business’s “America’s Nightly Scorecard, where he discusses economic trends ranging from the price of oil to the direction of the U.S. economy. He holds degrees from Georgetown University and Southern Methodist University.
© 2005-2022 http://www.MarketOracle.co.uk - The Market Oracle is a FREE Daily Financial Markets Analysis & Forecasting online publication.