UK Economic Crash, GDP Contracts by 1.9%
Economics / Recession 2008 - 2010 Apr 24, 2009 - 07:29 AM GMTBy: Nadeem_Walayat
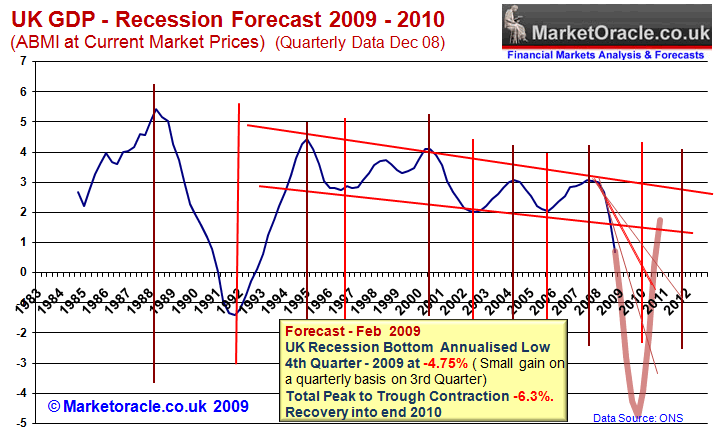
 UK GDP contracted by a shockingly high 1.9% for the first quarter of 2009, which was set against consensus forecasts for a 1.5% contraction. Barely 2 days ago the Chancellor Alistair Darling forecast GDP contraction of 3.5% for 2009, 1.25% growth for 2010 and 3.5% growth for 2011. At the time I stated that Alistair Darling forecasts implied a miraculous turnaround and was set against my own forecast as of February 09 for 2009 GDP contraction of 4.75%, with peak to trough contraction of -6.3%.
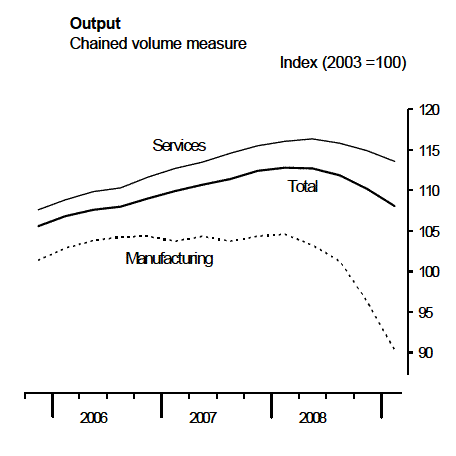
The volume of output in the production industries is estimated to have decreased by 5.5 per cent this quarter. Manufacturing output decreased by 6.2 per cent. Mining and quarrying decreased by 3.4 per cent and Electricity, gas and water supply decreased by 1.9 per cent. Output of the service industries is estimated to have decreased by 1.2 per cent.

Today's GDP data busts Alistair Darlings forecasts within a matter of days, as increasingly my forecast of -4.75% contraction for 2009 is becoming more probable. Many mainstream forecasting organisations are playing catchup by revising GDP lower for 2009 for instance the IMF now forecasts GDP contraction of -4.1% for 2009.

Total GDP contraction to date now stands at -4%, which is against my forecast for -6.3%, which strongly suggests that GDP contraction during the 2nd and 3rd quarters for 2009 'should' moderate i.e. we are unlikely to see another figure as bad as today -1.9%, more probably the 2nd quarter GDP is likely to range between -1% to -1.2%. Though today's much worse than expected data could result in an even deeper recession, for comparison the 1990-92 recession saw GDP contract by 2.5%; the early 1980's by 4.6% and the Great Depression witnessed contraction of approx 8% (though Britain had experienced a series of economic depressions following the end of World War 1 so the 8% figure does not paint a true picture). Therefore today's recession does look set to be the worst since the Great Depression of the 1930's.
Whilst a bounce back in the economy is expected going into 2010, however the tax hikes and spending cuts will in all likelihood trigger a double dip recession during 2011 to 2012, therefore instead of the mini-boom growth of 3.5% forecast by the Labour government, we may start to see the economy head for another double dip recession during 2012. What this means is that there will be a major shortfall in tax revenues and therefore a continuing budget deficits and hence deeper public spending cuts.
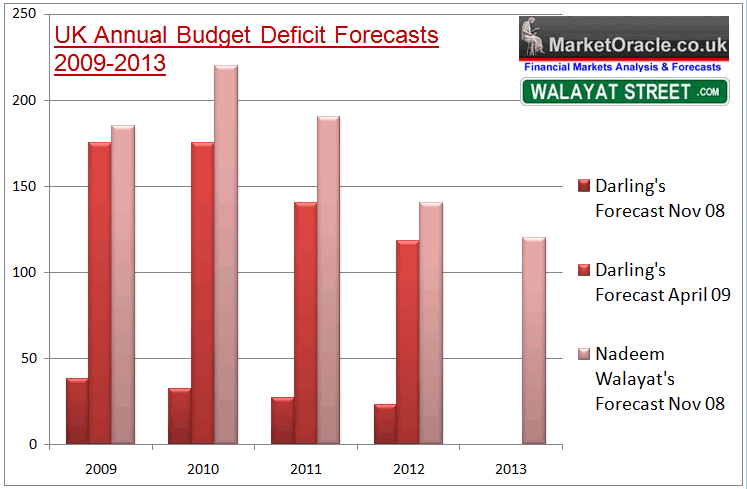
Alistair Darling's irresponsible budget resulted in a a net give away of £5 billion, against borrowing of £175 billion for 2009 as against the Chancellors own forecast of barely 6 months ago of borrowing of £38 billion. Instead of positioning the countries finances to cope with the huge public sector budget deficit the government has instead focused itself on the next general election which is still a year away.
The governments optimistic budget forecasts have been well and truly busted as the below graph illustrates the difference between expected budget deficits against Wednesdays revisions, set against my own budget deficit forecast.

Alistair Darlings forecast for government net borrowing over the next 4 years in November 2008 totaled just £120 billion which was in total denial of the collapse of the UK economy that had fallen off of the edge of a cliff during the summer of 2008 and accelerated during the September / October financial crisis. The magnitude of the level of the budgetary crisis is now some six months later being publicly acknowledged by revised forecasts for the budget deficit that the Chancellor now sees totaling £608 billion instead of the £120 billion forecast of November 08. This is still significantly below my forecast total of £735 billion and therefore the expectation remains for further revisions to the upside over the coming years.
Britain on the Path to Bankruptcy
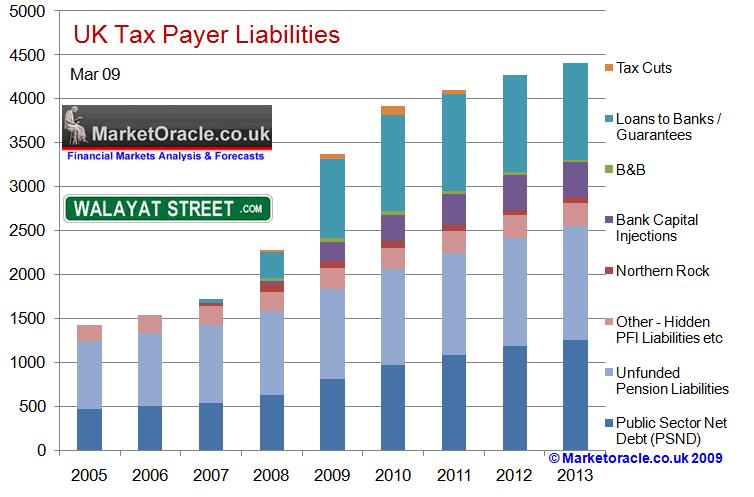
The level of debt is exploding higher, both that which is on the visible balance sheet as well as off the balance sheet tax payer liabilities that now project a rise from £1.5 trillion at the end of 2007 to £3.5 trillion by the end of 2010. As pointed out several times over the past 12 months following the Bank of England's initial £50 billion hand out to the soon to be Bankrupt banks in April 2008 that loan would in all likelihood never be repaid and mark the start of a series of hundred billion pound loans that would put Britain on the path towards a debt crisis that in the first instance would manifest itself in a sterling bear market whilst the Bank of England remained paralysed by the fear of inflation and failed to respond to the housing market crash of 2007-2009 until forced to do so in October 2008.

As the government issues more debt, i.e. gilts then the market will demand ever higher interest charges which means ever higher debt servicing costs. Taking the official debt, i.e. Public Sector Net Debt of £624 billion at the end of 2008 at a rate of 4% costs Britain £25 billion per year to service. However public sector net debt is expected to mushroom to 1359 billion by the end of 2012, which at 4% would demand a servicing cost of £54 billion a year. If however interest rates are significantly higher which is highly probable than the service costs at 7% would cost Britain £95 billion a year, these interest payments can only mean much higher taxes.
The in depth UK recession forecast update is due for completion following release of GDP data later today, to receive this in your in box make sure to subscribe to my always FREE Newsletter.
By Nadeem Walayat
http://www.marketoracle.co.uk
Copyright © 2005-09 Marketoracle.co.uk (Market Oracle Ltd). All rights reserved.
Nadeem Walayat has over 20 years experience of trading derivatives, portfolio management and analysing the financial markets, including one of few who both anticipated and Beat the 1987 Crash. Nadeem's forward looking analysis specialises on the housing market and interest rates. Nadeem is the Editor of The Market Oracle, a FREE Daily Financial Markets Analysis & Forecasting online publication. We present in-depth analysis from over 250 experienced analysts on a range of views of the probable direction of the financial markets. Thus enabling our readers to arrive at an informed opinion on future market direction. http://www.marketoracle.co.uk
Disclaimer: The above is a matter of opinion provided for general information purposes only and is not intended as investment advice. Information and analysis above are derived from sources and utilising methods believed to be reliable, but we cannot accept responsibility for any trading losses you may incur as a result of this analysis. Individuals should consult with their personal financial advisors before engaging in any trading activities.
Nadeem Walayat Archive |
© 2005-2022 http://www.MarketOracle.co.uk - The Market Oracle is a FREE Daily Financial Markets Analysis & Forecasting online publication.


