


The UK House Price /Gold Ratio: Bricks vs. Bars
Housing-Market / UK Housing Apr 29, 2009 - 02:42 PM GMTBy: Adrian_Ash

 "Top to bottom in the 1970s, house prices measured in gold lost four-fifths of their value all told..."
BEWARE THE CLAMOR to call the bottom in house prices.
Because with a tired predictability, the UK experience of seeing "green shoots" in every new survey says the global bust starting barely two years ago has a long way to run yet.
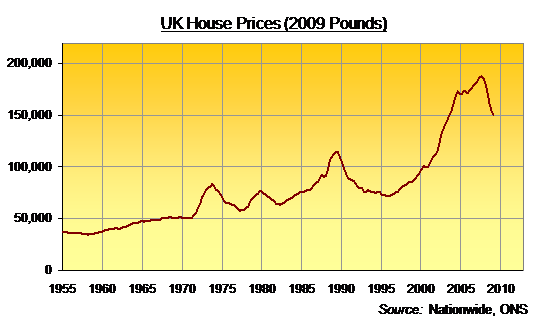
People who bought UK residential real estate in 1973, for instance, took until 1986 to break-even, on average, after accounting for inflation. Prices then doubled in the last half of the Eighties, before falling again for the next six years running, dropping nearly 40% (inflation-adjusted) and only regaining their peak in 2002.
Just as today, however, estate agents and lenders were eager to call the bottom early and often:
- "House prices to recover next year" Nov. 1989
- "Recovery forecast for house prices in market awash with loan funds" Jan. 1990
- "The bottom of the current house-price cycle may have passed" July 1991
- "House-price surge on the way, but wait for it" Sept. 1991
(All from The Times...)
Both up and down, in short, UK house prices – the very model of today's synchronized cycle – always run further, for longer, than most people expect.
Now the latest UK bubble has burst, average prices have seen only half that 40% loss to date. Priced against Gold, in fact – also touted as a "long-term" store of value, but proven through financial and economic turmoil instead of consumer-friendly bubbles in credit – UK real estate values could yet have much further to fall.
Already down by two-thirds, they might yet drop another two-thirds again.
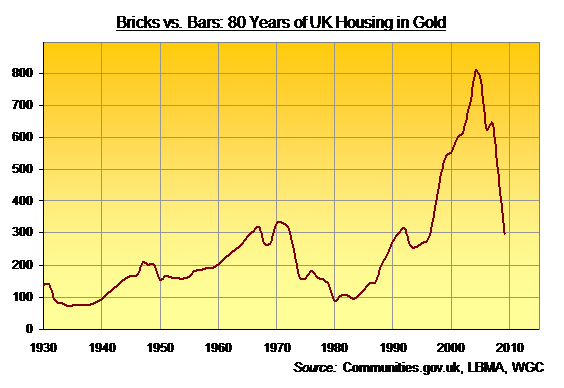
Top to bottom, UK house prices during the last bull market in gold – the inflationary Seventies – lost four-fifths of their value all told, dropping to equal just 89 ounces of metal on average in 1980.
So far in this post-bubble slump, anyone swapping gold bars for bricks has already seen their investment head for a treble, basis the 2004 average to first-quarter 2009. (N.B: The former Office of the Deputy Prime Minister, now bizarrely office- and department-free "Communities & Local Government", seems to have trouble matching its annual to monthly data. But its 17% drop in nominal prices used year-to-Feb. above rhymes with the big other surveys.)
The value of Gold priced in Sterling, however, remains below its eight-decade average in terms of housing. One ounce of metal now buys one-third of one per cent of the typical British pile, compared to the 1930-2009 average of 0.4%.
Given UK housing's habit of over-shooting both at the top and the bottom, however, returning to that extreme valuation beneath 100 ounces between 1980 and 1983 would see real-estate sellers now switching to gold today treble their investment once more before housing turns higher in terms of ounces of metal.
You might charge that Britain's housing stock has gained in real utility since Margaret Thatcher took power. But running water, gas and electric were supplied long before, and central heating became commonplace during the '70s. Still "the barbarous relic" squashing house prices back towards Great Depression levels, approaching – but not quite reaching – the 76-ounce level hit from 1934-1938.
In nominal prices, average UK home prices have risen 350 times over...going from £545 just before the Second World War to some £190,000 this month. Gold Prices, in contrast, have risen some 140-fold to stand near £610 an ounce at today's London close.
Those multiples may or may not now squeeze together. But either way, the loss of value in Sterling is clear – a long-run inflation that's sent property prices sky-high for both bricks and gold bars.
By Adrian Ash
BullionVault.com
Gold price chart, no delay | Free Report: 5 Myths of the Gold Market
City correspondent for The Daily Reckoning in London and a regular contributor to MoneyWeek magazine, Adrian Ash is the editor of Gold News and head of research at www.BullionVault.com , giving you direct access to investment gold, vaulted in Zurich , on $3 spreads and 0.8% dealing fees.
(c) BullionVault 2009
Please Note: This article is to inform your thinking, not lead it. Only you can decide the best place for your money, and any decision you make will put your money at risk. Information or data included here may have already been overtaken by events – and must be verified elsewhere – should you choose to act on it.
Adrian Ash Archive |
© 2005-2022 http://www.MarketOracle.co.uk - The Market Oracle is a FREE Daily Financial Markets Analysis & Forecasting online publication.