


Crude Oil, OIH and USO Special Trading Report
Commodities / Crude Oil May 04, 2009 - 12:40 AM GMTBy: Chris_Vermeulen

 The energy sector has been beaten down hard over the past 8 months. Since November it looks like it has been bouncing along the bottom with investors buying on the dips when dividends are high and prices are dirt cheap for many solid companies.
I must point out that the broad market and energy stocks look over bought and ready for a sharp pullback any day now. But if oil breaks out above $55 and starts rallying higher energy stocks will follow suit. Keeping our eye on crude oil prices is key here.
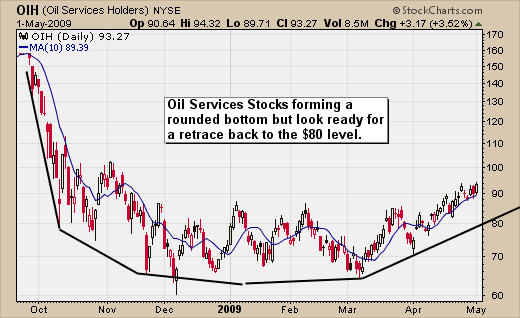
Oil Services Stocks Forming a Rounded Bottom Pattern
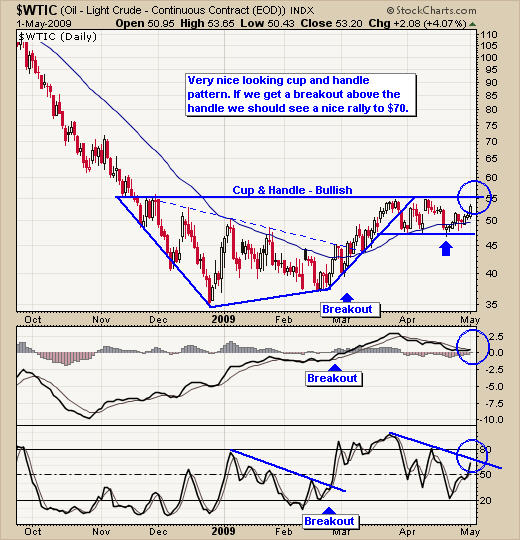
Light Crude Oil Trading Chart
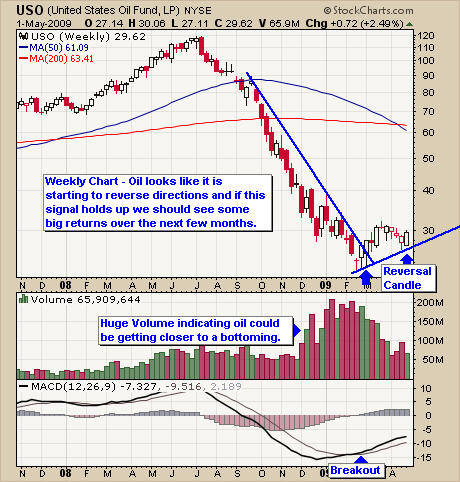
Weekly Reversal Signal
This Oil Fund has created an intermediate buy signal as of Friday’s close. It appears the price action for this fund is signaling a reversal. The long lower candle wick which was formed two weeks ago touched our support trend line and rallied strong into the close.
Then last weeks move higher completed the reversal candle. Risk for entering this trade is about 11% if you set your stop below the support trend line. I only focus on the daily charts and enter trades with 3% or less risk.
USO Crude Oil Trading ETF
Oil Trading Conclusion:
Oil and energy stocks look to be forming a bottom which is a great sign for oil and other energy products like natural gas.
Oil service stocks have been climbing for several weeks and look ready for some type of pullback. It could be a sideways move or a quick 2-3 day drop.
Crude oil prices continue to hold a solid cup & handle pattern as we wait to see which way prices will breakout. Waiting for a low risk setup in our trading funds is difficult but it must be done to keep our risk: reward ratio in line.
I posted a weekly chart of the USO Texas Oil fund because many you trade this. This weekly chart looks very bullish because over the past two weeks we have had a reversal pattern form. This type of setup is for longer term traders who carry more risk and provide more time for trades to mature.
If you would like more information on my trading model or to receive my Free Weekly Trading Reports - Click Here
I have put together a Recession Special package for yearly subscribers which is if you join for a year ($299) I will send you $300 FREE in gas, merchandise or grocery vouchers FREE which work with all gas stations, all grocery stores and over 100 different retail outlets in USA & Canada.
If you have any questions please feel free to send me an email. My passion is to help others and for us all to make money together with little down side risk.
To Your Financial Success,
By Chris Vermeulen
Chris@TheGoldAndOilGuy.com
Please visit my website for more information. http://www.TheGoldAndOilGuy.com
Chris Vermeulen is Founder of the popular trading site TheGoldAndOilGuy.com. There he shares his highly successful, low-risk trading method. For 6 years Chris has been a leader in teaching others to skillfully trade in gold, oil, and silver in both bull and bear markets. Subscribers to his service depend on Chris' uniquely consistent investment opportunities that carry exceptionally low risk and high return.
This article is intended solely for information purposes. The opinions are those of the author only. Please conduct further research and consult your financial advisor before making any investment/trading decision. No responsibility can be accepted for losses that may result as a consequence of trading on the basis of this analysis.
Chris Vermeulen Archive |
© 2005-2022 http://www.MarketOracle.co.uk - The Market Oracle is a FREE Daily Financial Markets Analysis & Forecasting online publication.