How to Trade Using Intra-Day Charts to Find Low Risk Entry Points In Any Market
InvestorEducation / Learn to Trade May 12, 2009 - 06:56 AM GMTBy: INO
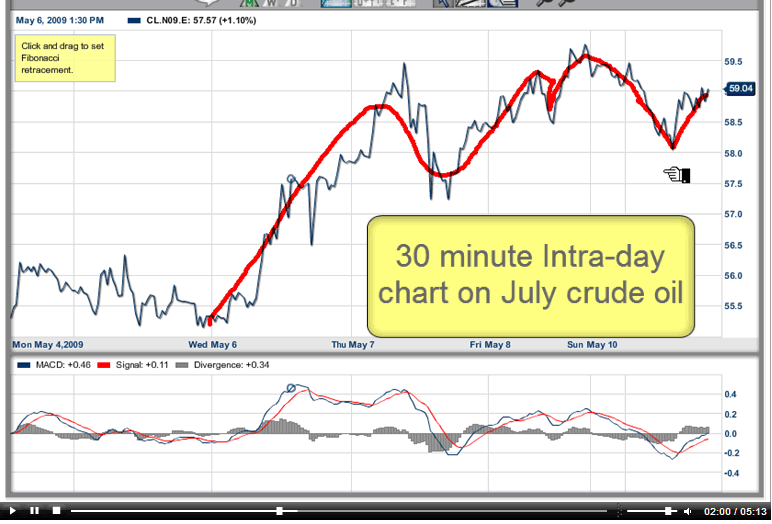
 In this short video, I will show you how to use intra-day charts to time low-risk entry points in any market that has an established trend. In this example, I am looking at a 30-minute chart of July crude oil (CL.N09). With all of my indicators in a positive trend for crude oil, I am looking for low risk entry levels where we can add to, or institute new positions.
This video will demonstrate how to move into a market even if you have missed the initial buy/sell signal.
You can view this new video with my compliments. There are no registration requirements. Please enjoy and give your feedback on our blog. Thank you.
All the best,
Adam Hewison
President, INO.com
Co-creator, MarketClub
By INO.com
INO and Quote Providers furnish quotes and market analysis without responsibility for accuracy and is accepted by the site visitor on the condition that transmission or omissions shall not be made the basis for any claim, demand or cause for action. The information and data was obtained from sources believed to be reliable, but we do not guarantee its accuracy. Neither the information, nor any opinion expressed, constitutes a solicitation of the purchase or sale of any futures or options..
INO Archive |
© 2005-2022 http://www.MarketOracle.co.uk - The Market Oracle is a FREE Daily Financial Markets Analysis & Forecasting online publication.


