Forensic Examination of the Gold Carry Trade, Is There A Supply Deficit?
Commodities / Gold & Silver 2009 May 13, 2009 - 10:52 AM GMTBy: Rob_Kirby
 If you ask the World Gold Council or their “official numbers keeper” - GFMS – they’ll say there is no persistent gold supply deficit. If you ask the folks at GATA – they’ll claim there is an annual 1,000 – 1,500 tonne gold supply deficit.
So who’s telling the truth?
What’s interesting to note in this regard – the World Gold Council and GFMS haven’t always shared the same view regarding gold supply / demand aggregates. Empirically their positions, at times, have been ambiguously at odds with each other and have lacked continuity. Here’s how GATA consultant Frank Veneroso explained the disparity back in 2005;
“As I explained in the Gold Book, gold demand had been understated for years by GFMS, the ‘official’ keeper of the global gold statistics, as has been the flow of official sector gold. Official stocks were falling faster than the GFMS data would suggest. I presented abundant statistical information to make that case. We believe that the trend in the official data since then simply flies in the face of obvious facts and this discredits it further.
People ask us where we think supply and demand are now. Our standard response is that we don’t know, because the data available to us has become ever less reliable. In the old days, the World Gold Council produced a data series on gold demand for most (but not all) of the world. It was based on extensive survey data and it had no reason to be biased. It clearly showed a stronger trend in the growth of gold demand (excluding Western investment) than did the GFMS supply/demand statistics. For us it was an anchor that allowed us to see a growing error in the GFMS data (see the Gold Book).
In the 1990s GFMS was faced with a problem. From the late-1980s to the late-1990s, there was a growing flow of borrowed gold associated with speculative short sales, the hedging of central bank options and commercial inventory hedging, in addition to the well recognized producer forward selling. There were also some official sector liquidations that were not reported. These totaled to extremely large official supplies. For some strange reason GFMS refused to acknowledge most of these official supplies, particularly those associated with speculator short sales. This resulted in a gross understatement of annual supplies.
Unlike the World Gold Council, which tried to only come up with an estimate of demand, GFMS estimated both supply and demand. In the end GMS had to make their estimates of demand and supply balance. Because they were underestimating supplies to an increasing degree, they had to underestimate demand to an increasing degree to make these accounts balance. That is why the World Gold Council survey showed a stronger gold demand trend in the 1990s than the GFMS statistics.
Several years ago the World Gold Council decided to merge its statistical efforts with GFMS leaving us, in effect, with only the GFMS supply/demand estimates. It has been my opinion that the GFMS balances became so flawed by the end of the 1990s that they had become virtually worthless. Therefore, I’ve regarded the new World Gold Council/GFMS statistics in recent years as basically useless. We no longer have any anchor for estimating gold demand and supply.”
That Central Banks “swap” and “lease” gold is an undeniable matter of public record. The extent of this activity is not acknowledged by GFMS or the World Gold Council. We do know that it necessarily has been responsible for filling any and all recurring gold bullion supply deficits.
The bottom line is that Central Banks claim to “officially” have somewhere in the neighborhood of 30,000 metric tonnes of gold bullion in their vaults. However, the reality is that Central Banks possess LESS physical gold than they officially report – how much less is a matter of speculation and a closely guarded secret.
The following formula explains the mechanics of the Gold Carry [lease] Trade:

** Do not confuse the Gold Forward Rate [GOFO] with the Gold futures price – they are not related.
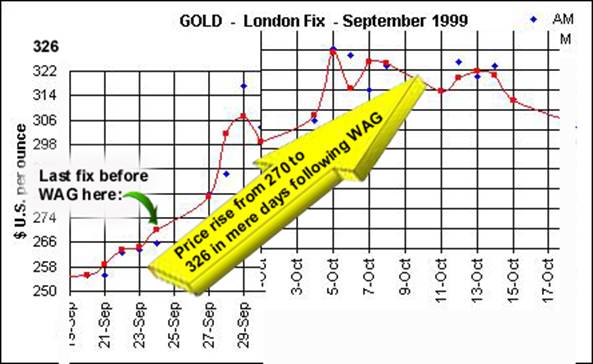
Now, we shall apply our lease rate formula to a “real world” case study where there is plenty of irrefutable evidence that gold leasing occurred; namely, in the aftermath of the Sept. 26, 1999 announcement of the first Washington Agreement on Gold – which was “sold” [as in a bill of goods, perhaps?] to the world as being ‘gold friendly’.
In the aftermath of the announcement of original Washington Agreement [WAG], announced Sept. 26, 1999, the World Gold Council reported;
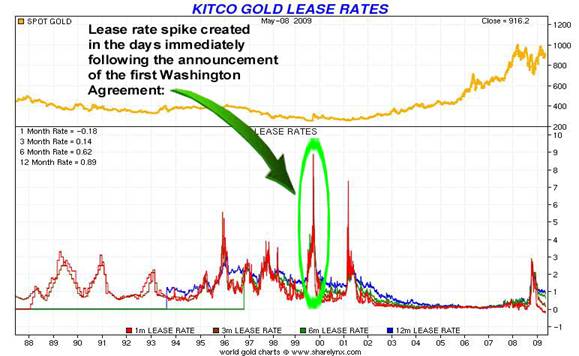
“Lease rates jumped to 10% in the first few days after the agreement, and though they have fallen back, they remain at a still high level of 4-5%, more than two times the rate the 1-2% the market is historically used to. The market remains tight, with very little gold coming onto it.”
What Happens When Gold Is Leased?
When Central Banks lease gold, it PHYSICALLY leaves the vault and the recipient / borrower sells the physical metal into the marketplace to raise cash – to invest or to finance capital expenditures. In this regard, we can say that “GOLD LEASING” is a means by which physical bullion is made available in the market place – thereby lowering the gold price. After the gold physically leaves the vault of the Central Bank, it is replaced with an I. O. U. and the Central Bank, for accounting purposes, “double counts” by continuing to claim that they still possess the same amount of physical bullion in the vault. It is notable that fraudulent accounting practices relating to gold is promoted by lawmakers the world over. This is contrary to generally accepted accounting practices and promotes market opacity instead of the much talked about need for transparency. Explicitly, it serves to promote the supremacy of the fiat U.S. Dollar as the world’s reserve currency.
I’ve circled the 10 % spike in lease rates on the chart below:

Ladies and gentlemen, what the spike in lease rates above depicts is the INDUCEMENT that was required to get BULLION BANKS to accept the “ELEVATED COUNTERPARTY RISK” inherent in arranging further bullion loans since, in the days following the Washington Agreement, the subsequent rise in the price of gold weakened existing bullion borrower’s financial position and made repayment of their physical bullion loans a trickier proposition:

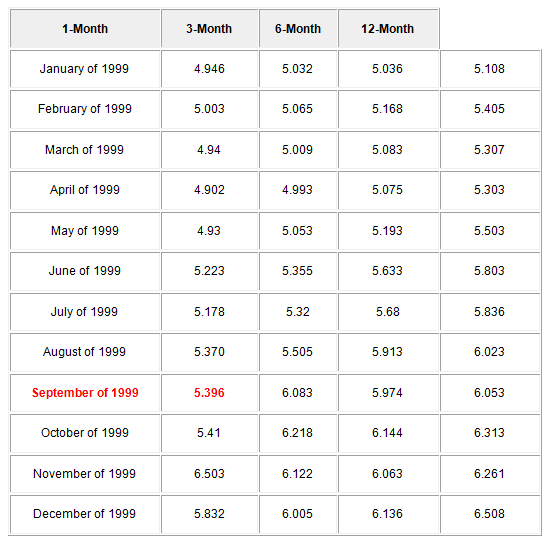
The borrowers of bullion pay LIBOR – but in bullion [the relevant month is highlighted in RED]:

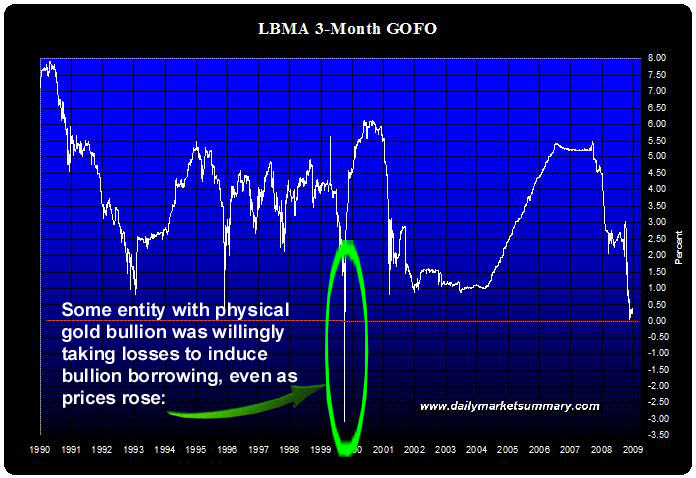
Now, let’s stop and consider WHO did the lending of metal in Sept. 1999 – expelling physical precious metal, intentionally at a loss, in the face of a RISING PRICE of GOLD. Remember folks, 3 month GOFO [the gold forward rate] is the return “earned” by the lender of bullion:

So ask yourself WHO would lend physical gold bullion to ANYONE with a guarantee that you would get LESS bullion back in 3 months????????????
Sir Alan of “I-looted-the-free-world” Greenspan gave us a good hint as to who might do such a thing when he twice testified before Congress in 1998 that "central banks stand ready to lease gold in increasing quantities [read: lose money] should the price rise."
Coincidentally, it is the lack of transparency concerning Central Bank gold leasing and the existence of double counting of gold stocks that, in Dec. 2007, prompted GATA to launch a freedom of information request campaign to wrest all documents from the Fed and U.S. Treasury in their possession that have been generated since 1990 and mention swaps of gold involving the U.S. government. Heck, even the I.M.F. admits that Central Banks double count gold, excerpted from I.M.F. issues paper # 11, April, 2006;
7. The current statistical treatment of gold swaps should be consistent with that of repos. The guidance of paragraph 85 (iii) of the Guidelines, which is applied to gold swaps by paragraph 101, results in overstating reserve assets because both the funds received from the gold swap and the gold are included in reserve assets. While the gold is swapped, it cannot be the case that both the claims and the gold are simultaneously liquid and readily available to the monetary authority.
The United States of America claims to possess a little more than 8,100 metric tonnes of sovereign gold stored principally at Fort Knox, Kentucky, West Point, N.Y. and The New York Fed. The sovereign U.S. gold reserve has not been independently audited since the 1950’s during the Eisenhower Administration. GATA’s freedom of information requests are all about ensuring that the 8,100 metric tonnes of U.S. sovereign gold is still owned the U.S. and is where it is purported to be.
In April, 2008 the Federal Reserve responded to GATA’s request, releasing part or all of hundreds of pages of worthless information, but also claiming that it was withholding all or part of the information of about 400 pages of documents. The status of the withheld documents is currently under appeal.
These stonewalling tactics – with holding details - are eerily similar to those employed by Messer’s Bernanke, Paulson and Geithner refusing to divulge frank details as to “who” the beneficial recipients were of TARP and TALF funds.
Got physical precious metal yet?
More for subscribers. Rob Kirby is proprietor of Kirbyanalytics.com and sales agent for Bullion Custodial Services. Subscribe to Kirbyanalytics news letter here. Buy physical gold, silver or platinum bullion here.
By Rob Kirby
http://www.kirbyanalytics.com/
Subscribers to Kirbyanalytics are learners, educating themselves; not only about the merits of ownership of gold and precious metals - but valuable know-how on the merits of different forms of ownership as well as tips and guidance on the acquisition of physical precious metal. In the members only section you'll find other subscriber only articles and the balance of this article with sections titled, Physical Bullion Buyers Guide, More on Madoff and Is War in the Cards?
Copyright © 2009 Rob Kirby - All rights reserved.
Disclaimer: The above is a matter of opinion provided for general information purposes only and is not intended as investment advice. Information and analysis above are derived from sources and utilising methods believed to be reliable, but we cannot accept responsibility for any trading losses you may incur as a result of this analysis. Individuals should consult with their personal financial advisors before engaging in any trading activities.
Rob Kirby Archive |
© 2005-2022 http://www.MarketOracle.co.uk - The Market Oracle is a FREE Daily Financial Markets Analysis & Forecasting online publication.


