


S&P 500 Stock Market Internals Then and Now
Stock-Markets / Stock Index Trading May 22, 2009 - 01:20 AM GMTBy: Richard_Shaw

 The S&P 500 index (proxy SPY and IVV) is in much better shape now than on March 6 (the low so far, and maybe the low). However, not all lights are flashing green yet.
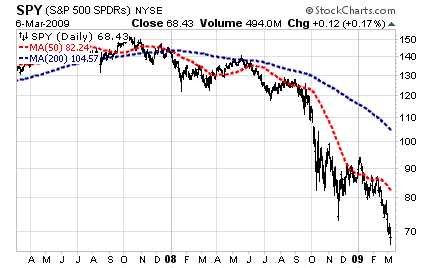
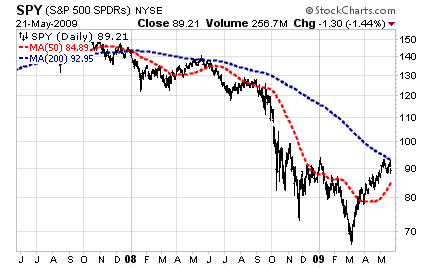
First at the macro level, SPY shows that the 200-day average and the 50-day average were both sloping down on March 6. Today the 50-day is sloping up, but the 200-day is still in a down trend, and the 50-day is still below the 200-day. That shows improvement, but it’s not a certain bull.
The SPY 200-day average was 104.57 on March 6. It is 92.95 today. The 50-day was 82.24 on March 6, and is 84.89 today.
SPY on March 6, 2009
Except for truly brave souls, prescient fundamentalists, veritable long-term risk takers, those who believe it is impossible to die falling out of a basement window, those who had not already fallen from a fifth floor window, and those who are just lucky, it would have been hard to put all the chips of the S&P 500 on March 6.
SPY on May 21, 2009
Now that most of us wish we were one of those types just described who had the whatever it took to bet on the S&P 500 on March 6, we must decide if the index is in a good place, an OK place or a perilous place.
We’re still pretty cautious, although green with envy for those who both got out before October 2008 and who got in around March 6, 2009 — probably not a big group, but there must be some.
The SPY price is not rising as steeply as earlier in the rally and the 200-day average appears to be giving it some resistance. Noted technical analyst John Murphy suggests the pattern is beginning to look like a reverse head and shoulders. If that is the case, we could expect a retrenchment to perhaps 750 before beginning a new ascent.
The news is still mixed, but with no absence of terrible elements. Most of the “green shoots” good news comes from politicians and political appointees who are expected to spin to the positive. They could be negative on the economy during the campaign, but now that they “own” the problem and have attempted their own solutions, they need to shift to the good news stories.
Internals:
On March 6, only 29 of the S&P 500 constituents were above their 50-day average. Today there are 409 above that average. Back in March, there were 302 constituents with an upward sloping 50-day average, and today there are 480. In March, the stocks were diving below their 50-day, and today they are rising above it, but not with the gusto they showed on the downside in March.
On March 6, only 5 of the S&P 500 constituents were above their 200-day average. Today there are 213 above that average. In March, the there were 18 stocks with an upward 200-day slope, while today there are 27 with an upward slope.
Lots of improvements, but if the 200-day average is viewed as a primary trend indicator, only 5% of the S&P 500 stocks are in a bull mode. So we are still very much in a transition that may or may not continue up before taking a further rest or a move backward to test market support.
Until the S&P 500 breaks 1000 to 1050 and is above its 200-day average, it will be hard for us to say mostly green lights are flashing.
We own a limited position in SPY in some but not all managed accounts — not much in any case
By Richard Shaw
http://www.qvmgroup.com
Richard Shaw leads the QVM team as President of QVM Group. Richard has extensive investment industry experience including serving on the board of directors of two large investment management companies, including Aberdeen Asset Management (listed London Stock Exchange) and as a charter investor and director of Lending Tree ( download short professional profile ). He provides portfolio design and management services to individual and corporate clients. He also edits the QVM investment blog. His writings are generally republished by SeekingAlpha and Reuters and are linked to sites such as Kiplinger and Yahoo Finance and other sites. He is a 1970 graduate of Dartmouth College.
Copyright 2006-2009 by QVM Group LLC All rights reserved.
Disclaimer: The above is a matter of opinion and is not intended as investment advice. Information and analysis above are derived from sources and utilizing methods believed reliable, but we cannot accept responsibility for any trading losses you may incur as a result of this analysis. Do your own due diligence.
Richard Shaw Archive |
© 2005-2022 http://www.MarketOracle.co.uk - The Market Oracle is a FREE Daily Financial Markets Analysis & Forecasting online publication.