U.S. Stock Market Follows Dollar and Bonds Lower as Commodities Surge
Stock-Markets / Financial Markets 2009 May 24, 2009 - 02:28 PM GMT “Words from the Wise” this week comes to you a bit later than usual and in a shortened format as my “day-job” demands keep me from doing my customary commentary. However, a full dose of excerpts from interesting news items and quotes from market commentators is provided.
Stock markets kicked off the last week on a high note, but then the US parted ways with other markets as the remaining four days went downhill for American stocks. In contrast, global markets in general had only one down day on Thursday.
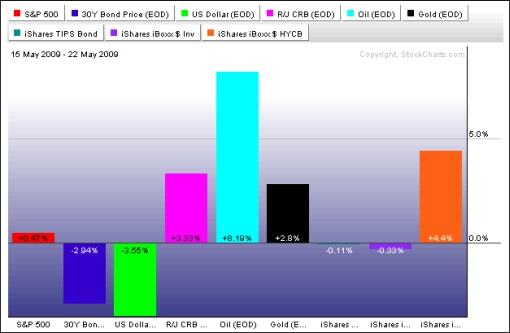
In addition to non-US equities, risky assets such as commodities, oil, gold, silver and platinum, and high-yielding currencies performed strongly amid fresh signs of “less bad” economic and financial conditions. However, safe-haven trades like the US dollar and government bonds got whacked, especially following Standard & Poor’s decision on Thursday to mark down its medium-term outlook for the UK’s AAA credit rating from “stable” to “negative”. This raised concerns that the US may face a similar fate.
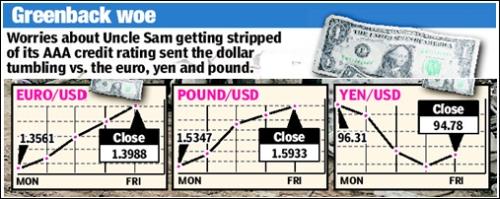
Source: New York Post, May 23, 2009.
As the implications of surging government debt levels move to center stage, the US Debt Clock makes for sobering reading. Click here or on the image below for the live version.
Source: US Debt Clock, May 23, 2009.
David Rosenberg, Merrill Lynch’s former chief North American economist, who has just commenced duty with buy-side firm Gluskin Sheff & Associates, commented as follows: “While the UK government debt-to-GDP ratio is around 40%, the rating agencies are looking at 100% in coming years. The US government debt/GDP ratio right now is near 65%, but clearly heading higher. It seems as though 100%+ is the trigger point for downgrades …
“So the view out there that the US is about to receive a credit downgrade despite the dramatic expansion of the government balance sheet is a little premature. For now, it makes for nice cocktail conversation but as super-sized as the deficit is (13% of GDP), there is enough room in the debt ratio that the US would likely have to run three more years of this sort of fiscal policy to be seen as a candidate for a downgrade.”
The performance of the major asset classes is summarized by the chart below.
Source: StockCharts.com
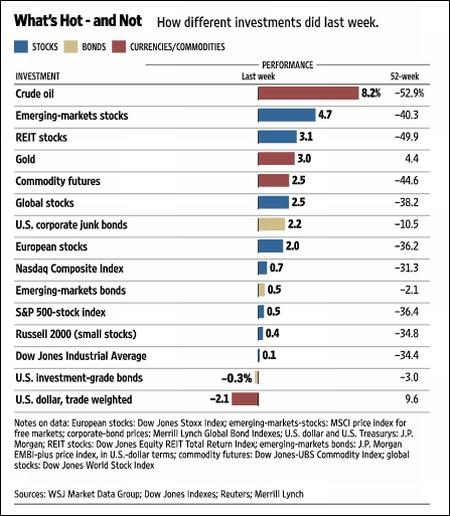
Following the previous week’s bruising, the MSCI World Index last week gained 2.2% (YTD +2.3%) and the MSCI Emerging Markets Index 5.4% (YTD +31.6%).
Similarly, the major US indices reversed course, but in a much more subdued fashion, as seen from the fairly flat movements of the major indices: S&P 500 Index (+0.5%, YTD -1.8%), Dow Jones Industrial Index (+0.1%, YTD -5.7%), Nasdaq Composite Index (+0.7%, YTD +7.3%) and Russell 2000 Index (+0.4%, YTD -4.4%).
The Nasdaq remains the only major US index still in the black for the year to date, finding itself in the company of the majority of emerging and mature markets.
Click here or on the table below for a larger image.
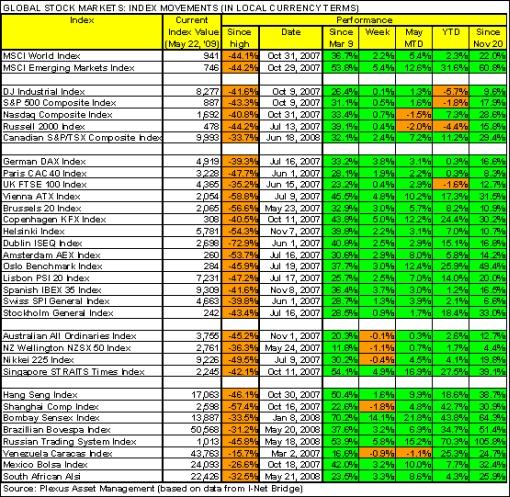
India’s BSE 30 Sensex Index (+14.1%) was the strongest market for the week, having rallied by 17.3% on Monday on unexpected election results. This was the biggest one-day gain in the 30-year history of the Index.
Elsewhere, returns ranged from top performers Sri Lanka (+12.5%), Cyprus (+12.3%), Luxembourg (+9.4%), Macedonia (+9.0%) and Nigeria (+8.8%), to Ghana (-8.9%), Malta (-1.2%), Palestine (-1.2%), Côte d’Ivoire (-1.1%) and Uganda (-1.1%), which experienced headwinds. Japan’s Nikkei 225 Average (-0,4%) put in the worst performance among the major markets. (Click here to access a complete list of global stock market movements, as supplied by Emerginvest.)
John Nyaradi (Wall Street Sector Selector) reports that as far as exchange-traded funds (ETFs) are concerned, Indian ETFs such as WisdomTree India Earnings (EPI) (+22.7%) and PowerShares India (PIN) (+21.6%) were going great guns. Other top-performing sectors were concentrated among commodity funds, helped by investors becoming less risk averse. Strong performers included MarketVectors TR GoldMiners (GDX) (+10.6%), United States Oil (USO) (+4.1%), and iShares Silver Trust (SLV) (+4.6%).
Conversely, safe-haven-related ETFs - US dollar and government bonds - and regional banks reacted negatively, with iShares Dow Jones US Regional Banks Index (IAT) declining by -5.3%, iShares 20+ Year Treasury Bond (TLT) by -4.8%, and PowerShares DB US Dollar Index Bullish (UUP) by -2.9%.
On the credit front, I updated my regular “Credit Crisis Watch” last week and concluded as follows:
“In summary, the past few months have seen impressive progress on the credit front, with a number of spreads having declined substantially since their ‘panic peaks’. The TED spread (down to 0.48% from 4.65% on October 10), LIBOR-OIS spread (down to 0.45%% from 3.64% on October 10) and GSE mortgage spreads have all narrowed considerably since the record highs.
“In addition, corporate bonds have seen a strong improvement, although high-yield spreads remain at elevated levels. Credit derivative indices for companies in all the major geographical regions have also shown a marked tightening since the November highs.
“Most indications are that the credit market tide has turned on the back of the massive reflation efforts orchestrated by central banks worldwide and that the credit system has started thawing. However, although the convalescence process seems to be well on track, it still has a way to go before confidence in the world’s financial system returns to more ‘normal’ levels and liquidity starts to move freely again.”
The quote du jour relates to the monetization process and belongs to Bill King (The King Report): “The dollar collapsed and inflation accelerated with Bernanke’s Treasury monetization. More monetization will yield higher inflation and a dollar debacle. The Fed, Treasury, administration and solons are being checked by the dollar and commensurate inflation … You can reference Jimmy Carter, G. William Miller, stagflation, dollar flight, the Misery Index and public revolt if you don’t believe us.”
In other news, Treasury Secretary Timothy Geithner on Wednesday testified before the Senate Banking Committee, saying that “there are important indications that our financial system is starting to heal”, and that the Treasury would soon be introducing its plan to team up with private investors to buy toxic assets from the banks. Separately, President Barack Obama on Friday signed into law a bill to put new restrictions on the credit-card industry, compelling card issuers to spell out their terms in fewer words - in plain English - and treat customers more fairly.
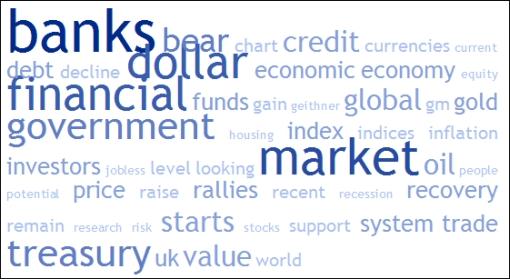
Next, a quick textual analysis of my week’s reading. No surprises here, with the word “banks” dominating the media. Strikingly, “dollar” is increasingly prominent as the greenback hit a five-month low.
Back to the stock market. An analysis of the moving averages of the major US indices shows the spring rally having encountered resistance at the important 200-day line and/or the early January highs. The highs of May 8 are the most immediate target to the upside, whereas the levels from where the rally commenced on March 9 should hold in order for base formations to remain in force.
Click here or on the table below for a larger image.

For more about key levels and the most likely short-term direction of the S&P 500, Adam Hewison of INO.com prepared another of his popular technical analyses. Click here to access the short presentation. (The analysis was done on Wednesday with the Index at 912, but is still as relevant as it was a few days ago.)
Jeffrey Saut (Raymond James) said: “… our sense is the equity markets are forming at least a near- to intermediate-term TOP and we are cautious. As Sy Harding writes, ‘Our Seasonal Timing Strategy is now in its unfavorable season. Our non-seasonal Market Timing Strategy is now on a new sell signal. We remain on the recent buy signal for gold and remain neutral on bonds.’
“Indeed, over the past few weeks technology, retail, housing, and cyclicals have broken their relative strength uptrends that have been intact since the March lows. Whether this turns out to be just another shallow correction, or something more enduring, will likely be determined by those groups whose relative strength still remains intact. Such groups include financials, agriculture, chemicals, oil drillers, and emerging markets.”
“Speaking of stocks, with the Averages backing off from their thrust at the May highs, it’s clear (at least to me) that the market is having second thoughts about the picture,” said Richard Russell, venerable writer of the Dow Theory Letters. “My guess is that those thoughts have to do with the sliding dollar, the sinking bonds with their higher yields - and last but not least - the surging price of gold. Dollar down, bonds down, gold up, it all fits together - trouble.”
For more discussion about the direction of stock markets, also see my recent posts “Gold bullion glitters brightly“, “Video-o-rama: Wall Street slumps on economic worries” and “Credit Crisis Watch: Thawing - noteworthy progress“. (Also, Donald Coxe’s webcast has been updated for May 22 and makes for good listening. This can be accessed from the sidebar of the Investment Postcards site.)
Economy
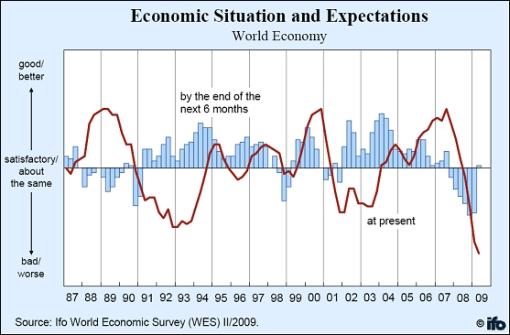
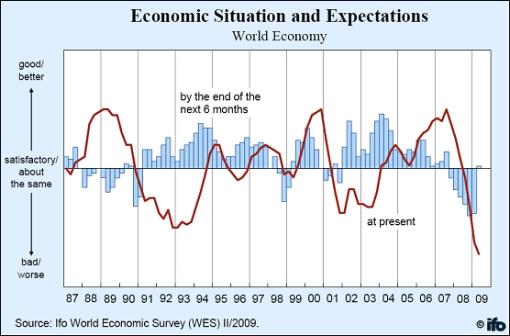
The Ifo World Economic Climate Indicator also rose in the second quarter of 2009 for the first time since autumn 2007. According to the Survey, “The rise in the indicator was the result of more favorable expectations for the coming six months; the assessment of the current economic situation, however, worsened again, falling to a new record low.”
Economic expectations have improved in all major regions, especially in North America and Asia. But the expectations for the coming six months for Western Europe, Central and Eastern Europe, Russia and Latin America are also clearly upwards.
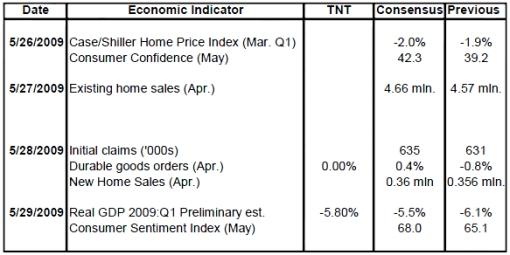
Turning to the US, a snapshot of the week’s economic data is provided below. (Click on the dates to see Northern Trust’s assessment of the various data releases.)
May 22 • Road map for the near-term performance of the economy
May 21 • Index of Leading Indicators signals improving economic conditions • Auto industry events will continue to distort jobless claims data
May 19 • Plunge in multi-family starts conceals small gain of single-family units
May 18 • Homebuilders Survey records improvement; will new home sales follow? • Discount window borrowing continues to trend down
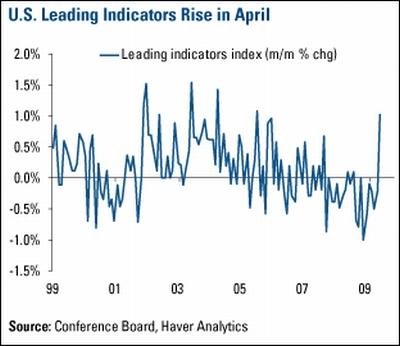
The chart below shows the Conference Board’s Leading Economic Indicator, which rose 1% month over month and is comparable to the increases seen at the end of the last recession.
Source: US Global Investors - Weekly Investor Alert, May 22, 2009.
According to Moody’s Economy.com, the minutes from the Federal Open Market Committee’s meeting late in April indicate that participants were more optimistic about the economy than they had been at their previous meeting in mid-March. While the economy remained in recession, there were numerous signs that the pace of contraction was slowing down.
“FOMC members agreed that the steps the committee had previously taken appeared to be providing an economic stimulus and that the Federal Reserve should continue with its previously announced policy actions, in particular ‘quantitative easing’, an expansion of the Fed’s balance sheet through the purchase of longer-term Treasuries, designed to bring down long-term interest rates,” said Moody’s Economy.com.
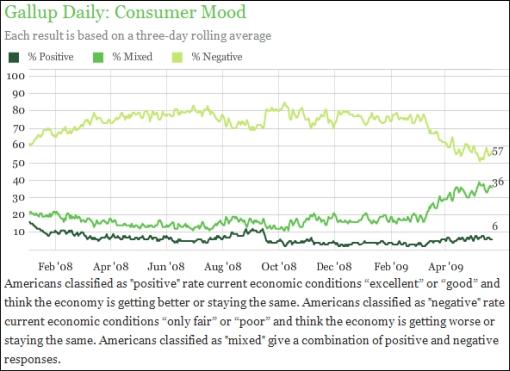
Gallup’s latest Consumer Mood poll, dealing with economic and market implications, shows that only 6% of Americans have a “positive” mood on the economy, but that the percentage of those that are ”negative” has dropped significantly since early March when the stock market advance started. Also, Americans whose mood is described as “mixed” have increased from the mid-teens to 36% as the negativity has subsided.
Source: Gallup Daily: Consumer Mood, May 22, 2009.
“This ‘mixed’ mood goes along with the ‘green shoots’ theory that some things are getting better and most things have stopped getting worse,” said Bespoke. “With Americans moving from ‘negative’ to ‘mixed’ before turning ‘positive’, does this imply that we’ll have a U-shaped recovery instead of a V?”
The last quote comes from Nouriel Roubini, via a Facebook status update: “The Green Shooters are starting to sweat and getting cold feet as evidence of pestilent yellow weeds is mushrooming.”
Week’s economic reports
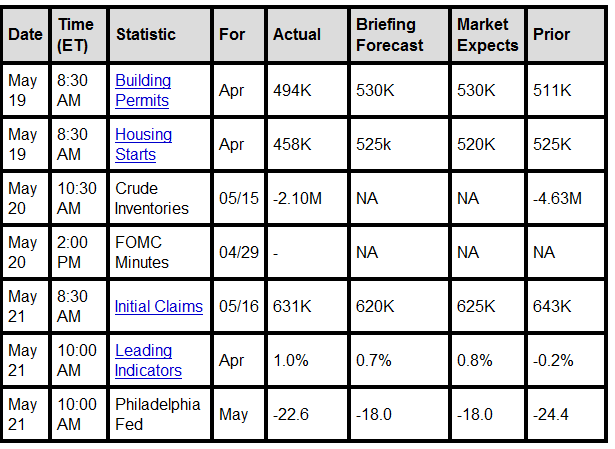
Click here for the week’s economy in pictures, courtesy of Jake of EconomPic Data.
Source: Yahoo Finance, May 22, 2009.
The US economic highlights for the week include the following:
Source: Northern Trust.
Click here for a summary of Wachovia’s weekly economic and financial commentary.
Markets
The performance chart obtained from the Wall Street Journal Online shows how different global financial markets performed during the past week.
Source: Wall Street Journal Online, May 22, 2009.
Louis Pasteur said: “Chance favors the prepared mind.” Hopefully the “Words from the Wise” reviews will assist Investment Postcards readers with the ongoing preparation that is required to manage your money wisely.
I hope you’re enjoying a great Memorial Day holiday weekend.
That’s the way it looks from Cape Town.
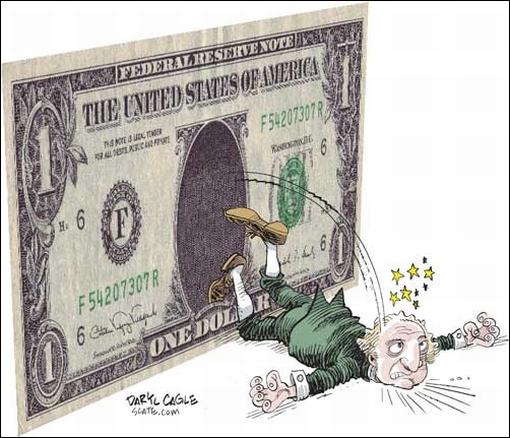
Source: Daryl Cagle, Slate.
CNBC: PIMCO’s El-Erian on this week’s selloff “Mohamed El-Erian, CEO and co-CIO of PIMCO, discusses this week’s market selloff and the possibility of the US losing its AAA credit rating.”
Source: CNBC, May 22, 2009.
The New York Times: Banks raised billions, Geithner says
“The country’s biggest banks have made moves to bolster their balance sheets by about $56 billion since the government disclosed the results of its financial ’stress tests’ two weeks ago, Treasury Secretary Timothy Geithner said Wednesday.
“Testifying before the Senate Banking Committee, Mr. Geithner said that the financial system had begun to ‘heal’, and that the Treasury would soon be introducing the next phase of its financial rescue effort - the plan to team up with private investors to buy billions of dollars in toxic assets from banks.
“‘There are important indications that our financial system is starting to heal,’ Mr. Geithner told lawmakers, though he cautioned that it was still too early to talk about an ‘exit strategy’ for the government.
“But lawmakers in both parties complained that the $700 billion aid plan, known as the Troubled Asset Relief Program, or TARP, had yet to revive bank lending in many parts of the country.
“‘The frustration level is mounting on an hourly basis,’ said Senator Christopher J. Dodd, Democrat of Connecticut and chairman of the banking committee.
“Senator Richard C. Shelby, Republican of Alabama who voted against the entire program last year, said the Treasury had ‘treated many sick banks’ but ‘certainly has not cured them’.
“In describing the banking system, Mr. Geithner, said that the country’s largest financial institutions had raised billions by issuing common stock and new debt, including $8 billion in bonds not guaranteed by the government.”
Source: Jack Healy and Edmund Andrews, The New York Times, May 20, 2009.
Financial Times: Smaller US banks need additional $24 billion
“Small and medium-sized US banks must raise some $24 billion to meet the capital standards set by the government in its stress tests of large institutions, research for the Financial Times shows.
“News of the potential capital shortfall could increase pressure on many of the 7,900 US banks that form the backbone of the US financial system.
“As many as 500 more banks could close, according to investment bank Sandler O’Neill, which carried out the research.
“Since this month’s release of the tests for the 19 largest banks, regulators and investors have increased their focus on the next tier of lenders, amid concerns some of them might struggle to survive if the economy worsens.
“The government’s stress-case would result in capital shortfalls for 38% of the 200 banks below the 19 largest financial institutions, leading to a deficit of around $16.2 billion in common equity, according to Sandler O’Neill.
“Applying similar criteria to the remaining 7,700 banks in the US would result in a further $7.8 billion capital deficit.
“The banks have to repay a combined $27 billion in aid from the Troubled Asset Relief Programme (Tarp) but they could do that from internal resources rather than raising more funds.
“The US Treasury has said that it does not intend to extend the stress tests beyond the 19 top institutions it examined. But analysts say that the public release of the government’s test methodology and capital adequacy philosophy means that the tests’ standards will become a model for the rest of the US banking system.”
Source: Saskia Scholtes, Julie MacIntosh and Francesco Guerrera, Financial Times, May 17, 2009.
Financial Times: US banks scramble to repay bail-out cash
“US banks are scrambling to be in the first wave of lenders to repay Washington bail-out funds after the authorities told Wall Street executives they would allow five or six big financial groups to return taxpayers’ money before the rest of the industry.
“Bankers said they expected the Treasury and Federal Reserve - which doled out billions of dollars from the $700 billion troubled assets relief programme to lenders last year - to name the first repayers in the next few weeks.
“The authorities decided to allow a group of banks to return the funds, rather than approving individual applications, to avoid a ‘rush for the exit’ by lenders vying for bragging rights of being the first to repay, said people close to the matter.
“The timing of the repayment and the number and identity of the banks in the first wave is still under discussion.
“Goldman Sachs, JPMorgan Chase and American Express, which were found not to need additional equity in the recent stress tests, are almost certain to be in the first grouping.”
Source: Francesco Guerrera and Krishna Guha, Financial Times, May 18, 2009.
Bloomberg: Geithner says Treasury may move “quickly” to sell TARP warrants
“Treasury Secretary Timothy Geithner said he’s inclined to ‘quickly’ sell warrants the government got when injecting capital into banks, offering prospects of a speedy exit to lenders seeking to retire government stakes.
“‘In general, our objective will be to sell these warrants as quickly as we can,’ Geithner told the Senate Banking Committee today. ‘What I’m reluctant to do is have the government be in a position where we hold these investments for a long period of time, longer than is desirable, in the hopes that we’re going to maximize value.’
“The Treasury received warrants with nearly every capital injection it made with its $700 billion bank-rescue fund, called the Troubled Asset Relief Program. As big banks begin to pay back the assistance years earlier than expected, the Treasury may use market bidding to break a logjam over how to value a key component of the government’s equity stakes.
“The total value of the government’s bank warrants is roughly $5 billion, according to Treasury calculations.
“If the Treasury can’t agree with banks about the value of the warrants, the government may try to sell them at auctions, a Treasury official said in an interview this week. That’s because investor offers may be the only way to put a clear value on warrants that can vary widely depending on the model used.”
Source: Rebecca Christie, Bloomberg, May 20, 2009.
Financial Times: US poised for finance regulation shake-up
“Congress will next month start the biggest regulatory overhaul of the US financial system in decades, bringing into the open a frantic lobbying effort between banks, regulators and policymakers on what it contains and who pays for it.
“The House financial services committee, chaired by Democrat Barney Frank, will hold hearings early in June into reforms outlined by Timothy Geithner, Treasury secretary, say people familiar with the timetable.
“But the complexity, coupled with a crowded legislative agenda, means one key pillar - a resolution authority allowing a regulator to seize a failing bank holding company - is not likely to be put in place until year-end.
“The cost of the resolution authority and a proposed systemic risk regulator could be borne by both large banks and small, according to people involved, in spite of the entreaties from the hundreds of small US institutions that they should not pay a levy.
“Cam Fine, chief executive of the Independent Community Bankers of America, said the authority ’should be totally funded by those institutions that are regarded as systemically important or too big to fail’. He said he ‘felt pretty good about where we stand’ and was confident of Mr Geithner’s support.
“Other smaller institutions such as hedge funds are also expressing concern that they will suffer from severe ‘haircuts on contracts’ entered into as counterparties with the seized institution, according to one lobbyist.
“Sheila Bair, the chairman of the Federal Deposit Insurance Corporation, has been lobbying for early introduction of seizure powers that could be used to take over a large systemically important bank if it was severely weakened by another sudden downturn in the economy.
“Mr Geithner has said new powers would allow for an orderly winding up of a systemically important institution, avoiding a repeat of the messy fall-out from Lehman Brothers’ collapse last year or the expensive bail-out of AIG, the insurer.”
Source: Tom Braithwaite, Sarah O’Connor and Krishna Guha, Financial Times, May 17, 2009.
The New York Times: Senate passes bill to restrict credit card practices
“The Senate voted overwhelmingly on Tuesday to put new restrictions on the credit card industry, passing a bill whose backers say will make card-issuers spell out their terms in fewer words, using plain English, and treat customers more fairly.
“The 90-to-5 vote, following a 357-to-70 vote in the House on April 30, made it likely that President Obama will have a measure on his desk before the Memorial Day recess. The differences between the House and Senate versions will have to be worked out, but given the political atmosphere it seems likely that the House-Senate negotiations will move quickly.
“The industry has asserted that the legislation may backfire, forcing banks to issue fewer credit cards at greater cost to the current cardholders and making credit harder to get at a time when many Americans need it.”
Source: David Stout, The New York Times, May 19, 2009.
Financial Times: UK looks towards sale of bank stakes
“Britain has begun taking soundings with sovereign wealth funds and other investors about selling stakes in its part-nationalised banks as it seeks to tap into a revival of stock market confidence in the financial sector.
“UK Financial Investments, which manages the government’s 43.5% stake in Lloyds Banking Group and 70% stake in Royal Bank of Scotland, could start the process of selling tranches in both banks within a year, according to people briefed on the organisation’s plans.
“Lloyds on Monday launched an open offer to replace £4 billion of preference shares held by the government with new ordinary shares. The move followed the weekend announcement of the planned departure of Sir Victor Blank as Lloyds chairman amid investor unrest over his role in the bank’s much-criticised takeover of HBOS last year.
“UKFI has already had substantial contact with potential investors, including UK institutions and foreign organisations such as sovereign wealth funds, to gauge their interest.
“‘A lot of people around the world think once you get through the losses the earnings power of these banks will be formidable,’ said one person familiar with the situation.
“The organisation is likely to exit its stakes in tranches over a period of time although ‘these might be quite large dribs and drabs’, according to people close to the matter.”
Source: Jane Croft and Patrick Jenkins, Financial Times, May 18, 2009.
BCA Research: Euro area banks - stressful situation “The euro area’s attempt to stress-test the banking system is likely to prove fruitless.
“The Committee of European Banking Supervisors has designed a set of scenarios, which are currently being used by national regulators and central banks to evaluate the euro area banking system. However, the stress tests will not conclude until September, the assumptions used and the results will remain a secret, and the focus will not be on individual banks but rather the system as a whole.
“It is hard to argue that this process will help provide clarity regarding bank balance sheets or ease investor concerns over the potential for enormous losses. Up to the end of last year, European banks (excluding the UK) had only accounted for $224 billion in bad loans. The IMF estimates that another $875 billion will need to be written down by the end of 2010, compared with another $550 billion in the US banking system. Losses for the next two years are enough to wipe out all of the European banking system’s tangible capital, before considering earnings over the period.
“The IMF results are roughly consistent with our own calculations for the top 20 banks. It would take just over 2% in writedowns of assets to eliminate all tangible equity (US banks have roughly 3%). It is possible that banks’ access to private capital will improve and, together with future operating earnings, further asset writedowns will be easily absorbed. Still, the stress tests as currently envisioned will do little to bring clarity to the situation or restore investor trust.
“One positive development is that the German Cabinet has agreed to a ‘bad bank’ scheme to remove toxic assets from bank balance sheets. The proposal still needs parliamentary approval but would be helpful, at least for the German financial sector.”
Source: BCA Research, May 19, 2009.
The New York Times: GM draws another $4 billion from Treasury
“General Motors, facing the almost certain prospect of a bankruptcy filing, said Friday that it had drawn another $4 billion from the Treasury Department, raising its total from the government to $19.4 billion.
“GM originally said that it would need an additional $2.6 billion from the government to operate through June 1, but added $1.4 billion to that amount.
“The company, in a regulatory filing, also increased - to $7.6 billion - the amount it said it would need from the Treasury after June 1, the deadline set by the Obama administration for a restructuring plan.
“GM gave the Treasury a note for $266.8 million as security against the additional money that it borrowed on Friday. The financing does not appear to be the last that GM will draw, according to the filing with the Securities and Exchange Commission.
“It says that by June 1, it expects to have borrowed a total of $21.4 billion from the Treasury. In its original request to Congress last fall, GM asked for $18 billion in loans to keep it afloat while it restructured. With its latest injection from Treasury, it has surpassed that request.
“Lawyers for GM and the government are preparing documents for a GM bankruptcy filing, which is expected to come around June 1.
“People briefed on GM’s finances said the automaker would require debtor-in-possession financing during its reorganization of $40 billion to $70 billion.
“If GM drew the full $70 billion while in bankruptcy, the government would have provided the company with more than $90 billion in total, including the money it has drawn to date.
“Also on Friday, the Canadian Auto Workers union said that it had reached a second cost-cutting agreement with General Motors of Canada, even as bondholders for the parent company stood firm in their decision to reject an offer to convert their debt into GM stock.
“The automaker has offered its bondholders 225 shares for each $1,000 worth of debt, which over all would give them a 10% stake in the company.
“The company has said that it needs 90% approval from its bondholders by Tuesday if it is to avoid a bankruptcy filing. But the committee of GM’s biggest bondholders, which represent 20% of the overall debt, said there was no support for the current offer. Bondholders have said that competing creditors, like the UAW, have received better treatment.”
Source: Bill Vlasic and Ian Austen, The New York Times, May 22, 2009.
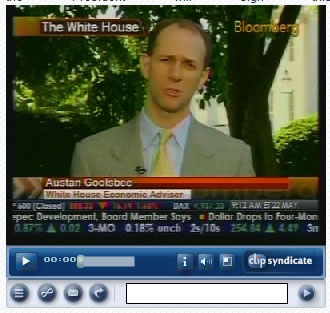
ClipSyndicate: In-depth look at GM bankruptcy looming
“Interview and discussion with White House Economic Adviser, Austan Goolsbee. He talks about President Obama’s plans for GM’s restructuring, the resignation of AIG CEO Edward Liddy and the impact of the credit-card bill that the President will sign this afternoon [Friday].”
Source: ClipSyndicate, May 22, 2009.
Financial Times: Declining Libor
“As a barometer of the financial crisis, it’s been hard to beat Libor, the London interbank offered rate for borrowing short-term funds in the banking system.
“On Wednesday, dollar Libor for the benchmark three-month sector set at 0.71625 per cent, extending its run of declines for 36 straight days. A comparison of Libor with the Fed funds rate shows that the gap between these two rates is at its lowest level since February 2008. Traders forecast further improvement on Thursday. The mood is a world away from the stressful peaks of Bear Stearns’ rescue last March and the failure of Lehman Brothers in September when Libor took a rocket ship to the moon.
“Further evidence that the banking system is stabilising is seen by activity in financial commercial paper. Lending for three months is back above that of the one-month sector for the first time since late January when the Federal Reserve’s support temporarily boosted 90-day paper. Quantitative easing and the smooth completion of the stress tests for banks has eased tension. That has helped nurture the recovery in risky assets.
“For the banking system, however, there are still signs of dislocation. Swap spreads, the difference between government bond yields and money market rates and a measure of bank credit quality, remain some way from looking normal. Liquidity also remains questionable as banks seek stronger balance sheets and raise capital to pay back government support.
“The steady declines in three-month Libor have also reduced the Ted spread, which compares the bank lending rate with that of three-month Treasury bills. After surging to record levels, the much lower Ted spread is another good sign. But with bills only yielding 0.18 per cent, it’s clear there remains an aversion to lending money at the much higher unsecured rate of three-month Libor.”
Source: Michael Mackenzie, Financial Times, May 20, 2009.
Ifo: Ifo World Economic Climate brightens
“The Ifo World Economic Climate Indicator rose in the second quarter of 2009 for the first time since autumn 2007. The rise in the indicator was the result of more favourable expectations for the coming six months; the assessment of the current economic situation, however, worsened again, falling to a new record low.
“The economic expectations improved in all major regions, especially in North America and Asia. But also in Western Europe, Central and Eastern Europe, Russia and Latin America the expectations for the coming six months have been clearly corrected upwards. In contrast, the current economic situation in all major regions is still assessed as markedly unfavourable, with the worst appraisals coming from North America and Western Europe.”
Source: Ifo, May 19, 2009.
Nouriel Roubini (Forbes): Don’t believe the optimists
“Recent data suggest that the rate of economic contraction in the global economy is slowing down, and that we are closer than we were six months ago to the trough of the recent severe global recession.
“But while the rate of economic contraction is now lower than the free-fall and near-depression experienced by many economies in the fourth quarter of 2008 and the first of 2009, the recent optimism that ‘green shoots’ of recovery will lead to the recession to bottom out by the middle of this year - and that recovery to potential growth will rapidly occur in 2010 - appears grossly misplaced, for three noteworthy reasons.
“First, the current deep and protracted U-shaped recession in the US and other advanced economies will continue through all of 2009, rather than reach a trough in the middle of this year as expected by the optimists.
“Second, rather than a rapid V-shaped recovery, growth will remain sluggish and sub-par for at least two years into all of 2010 and 2011. A couple of quarters of more rapid growth cannot be ruled out as we get out of this recession toward the end of the year or early next year as firms rebuild inventories and the effects of the monetary and fiscal stimulus reach a delayed peak. But structural weaknesses of the US and the global economy will cause both a below-trend growth and even the risk of a reduction of potential growth itself.
“Third, we cannot rule out a double-dip W-shaped recession, with the wings of a tentative recovery of growth in 2010 at risk of being clipped toward the end of that year or in 2011. This will result from a perfect storm of rising oil prices, rising taxes and rising nominal and real interest rates on the public debt of many advanced economies, as concerns rise about medium-term fiscal sustainability and the risk that monetization of fiscal deficits will lead to inflationary pressures after two years of deflationary pressures.”
Click here for the full article.
Source: Nouriel Roubini, Forbes, May 21, 2009.
Casey’s Charts: Recession hits the Treasury
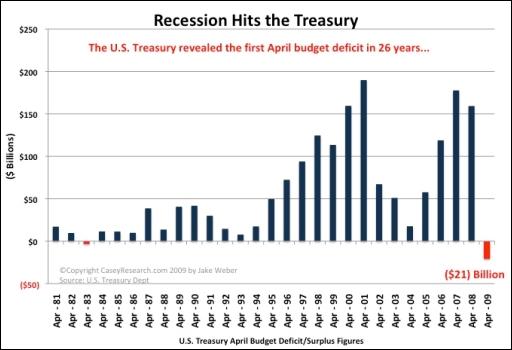
“The magnitude of the recession was underscored by the latest numbers from the US Treasury: last month’s individual income tax receipts dropped 44% and corporate tax revenue plunged 65% compared to April 2008. Alarming news, as April is historically the biggest collection month of the year and usually results in a sizable budget surplus for the month.
“As Casey Research Chief Economist Bud Conrad correctly predicted back in January, the initial $1.2 trillion deficit for 2009 was grossly underestimated. The Congressional Budget Office estimate is not only riddled with low-ball expenditure figures and accounting trickery, it also failed to anticipate a precipitous collapse in tax revenues.”
Source: Casey’s Charts, May 19, 2009.
Asha Bangalore (Northern Trust): Index of Leading Indicators signals improving economic conditions
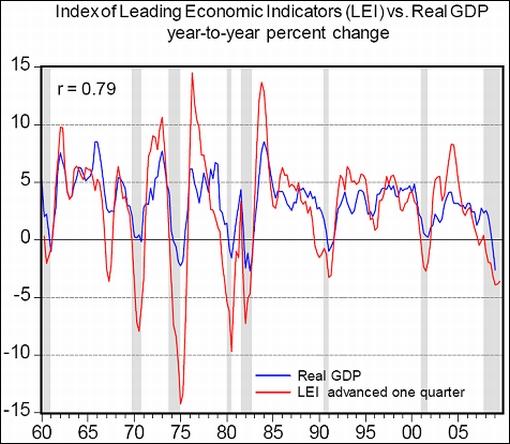
“The Conference Board’s Index of Leading Economic Indicators (LEI) moved up 1.0% after a string of monthly declines between October 2008 and March 2009. The increase of the index in April reflects a widespread improvement as seen in the 70% diffusion index for April.
“On a year-to-year basis, the LEI fell 3.0% in April, after a 4.0% drop in the November-December months of 2008. The year-to-year change in LEI on a quarterly basis dropped 3.6% in the second quarter (based on April data). It is the second consecutive decline which is smaller than the 3.9% drop of the fourth quarter of 2008.
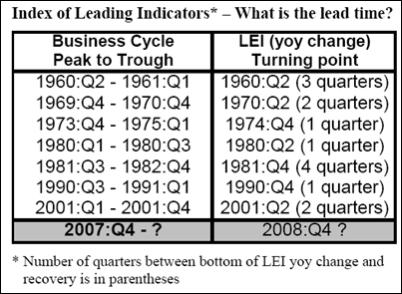
“The chart below illustrates that the year-to-year change in LEI bottoms out well ahead of the end of a recession. The table lists the details related to this observation. Based on the history of the LEI, the 3.9% drop in the fourth quarter could be the bottom for the current cycle; we will need additional monthly data to confirm this assessment.
“At the present time, we can temporarily conclude that the worst of the decline in economic activity is part of history. The number of quarters, deduced from the history of the LEI, before recovery commences after the year-to-year change of the LEI has recorded a bottom for the cycle varies between one and four quarters.”
Source: Asha Bangalore, Northern Trust - Daily Global Commentary, May 21, 2009.
Asha Bangalore (Northern Trust): Auto industry events will continue to distort jobless claims data
“Initial jobless claims fell 12,000 to 631,000 during the week ended May 16. The prior week’s reading of initial jobless claims was raised to 643,000 from the earlier estimate of 631,000.
“The large movements of initial jobless claims in the past two weeks from 605,000 in the week ended May 2 is largely due to auto industry events. The four-week moving average of initial jobless claims is 628,500 and it appears to have peaked in the first week of April at 658,750. The Chrysler and GM plant shutdowns and reopening in the next few months are most likely to distort jobless claims data.
“The tentative conclusion is that initial jobless claims are trending down, albeit holding at a high level.
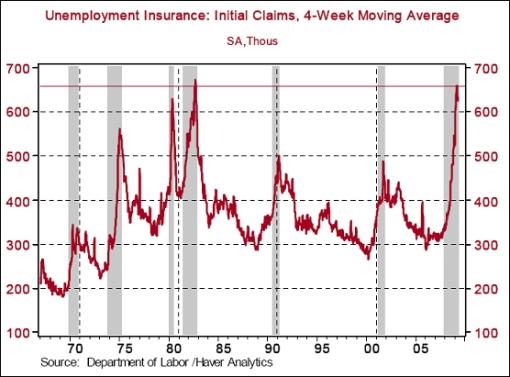
“The 1990-91 and 2001 recessions were both jobless recoveries with jobless claims posting significant declines only well after the recovery was underway. There is a strong likelihood the current recession may also be followed by a jobless recovery. We will need to see significant and consecutive weekly declines in jobless claims to declare that the worst is behind us.”
Source: Asha Bangalore, Northern Trust - Daily Global Commentary, May 21, 2009.
Asha Bangalore (Northern Trust): Homebuilders survey records improvement, will new home sales follow?
“The Housing Market Index (HMI) of the National Association of Home Builders rose to 16 in May from 14 in April. The HMI has advanced in three out of the four months ended May. Sales of new single-family homes rose 8.2% in February and edged down 0.6% in March. The sales tally for new single-family homes during April will be published on May 28. There is a strong positive correlation with the HMI and actual sales of new homes.” 
Source: Asha Bangalore, Northern Trust - Daily Global Commentary, May 18, 2009.
Asha Bangalore (Northern Trust): Plunge in multi-family starts conceals small gain of single-family units
“Housing starts fell 12.8% to an annual rate of 458,000, a new record low. Total housing starts have fallen 80% from the peak in January 2006.
“In April, multi-family starts plunged 46.1% and single-family starts advanced 2.8%. Single-family starts held steady in February and rose 0.3% in March. Starts of new single-family homes have declined each month during July 2007-January 2009, with the exception of a small increase in May 2008. The recent movements suggest that single-family starts appear to be establishing a bottom.
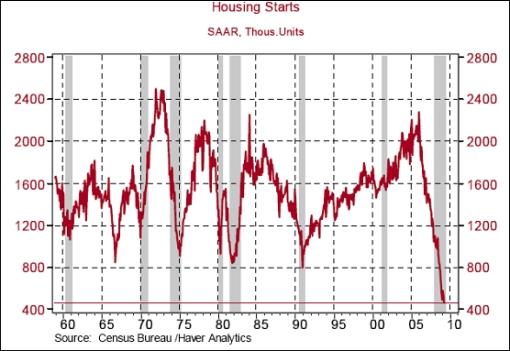
“At the same time, the elevated level of unsold new single-family homes (10.7-month supply in March, down from peak of 12.5-month supply in January) is a drag on new construction. The good news is that inventories of new unsold single-family homes appear to have peaked in January 2009.
“Pulling together the different pieces of news from the housing market, the housing starts report for April leans on the side of optimism because the pace of decline could have accelerated further. Instead, it appears that there is a moderating trend in place with support from other reports. The key to a complete recovery is, of course, a turnaround in employment conditions.”
Source: Asha Bangalore, Northern Trust - Daily Global Commentary, May 19, 2009.
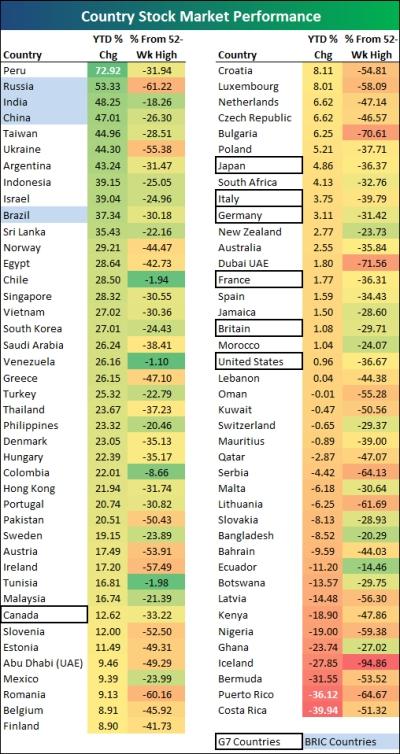
Bespoke: Country returns “With global equity markets still in rally mode, below we highlight the year to date performance of the major indices for 83 countries around the world. After nearly every country was down earlier in the year, 62 out of the 83 are now up in 2009.
“Peru is up the most at 72.92%, while Costa Rica is down the most at -39.94%. And the BRIC (Brazil, Russia, India, China) countries are significantly outperforming the developed G-7 countries. Russia, India, and China rank 2nd, 3rd, and 4th in terms of year to date performance, and Brazil isn’t far behind in 10th place.
“Canada has been the best performing G-7 country with a gain of 12.62% in 2009, but it ranks 35th out of 83. The rest of the G-7 countries are bunched up in the 0%-5% range, which is closer to the bottom of the list than the top. And the US is the worst of the seven with gains of less than 1%. While the markets here in the US have rallied nicely off of their March lows, most other countries have bounced back even more 2009.”
Source: Bespoke, May 19, 2009.
Bespoke: Recent performance of key ETFs
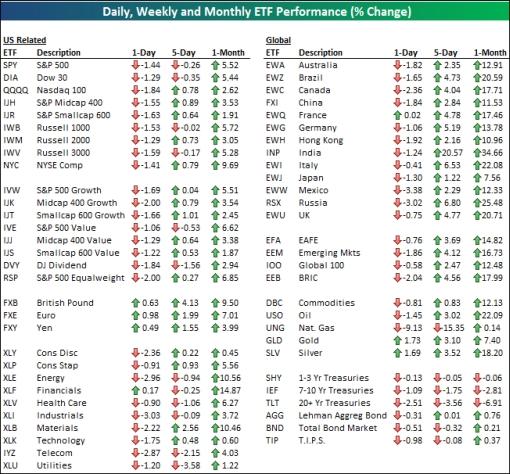
“For those interested in a quick snapshot of how various ETFs across all asset classes have performed recently, below we highlight their 1-day, 5-day, and 1-month performance. As far as equities go, there was lots of red today [Thursday], but there’s still lots of green over the last month.”
Source: Bespoke, May 21, 2009.
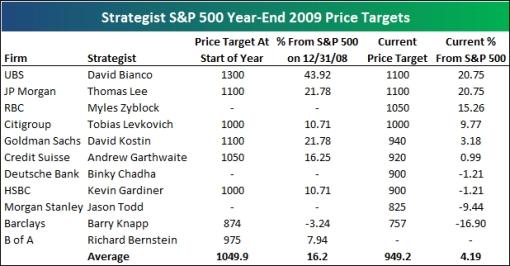
Bespoke: Strategists keep 2009 S&P 500 price target at 949
“The Wall Street strategists that Bloomberg polls each week haven’t changed their year-end S&P 500 price targets since mid-March. But by doing nothing, they’re collective price target has gotten much closer to the actual level of the index since the market has rallied so much.
“At the start of the year, strategists as a whole were looking for a year-end S&P 500 price of 1,049, which would have meant a gain of 16.2% for the year. When the market was down more than 20% in early March, this bullish price target was pretty bad. As the market fell, strategists cut their year-end target, which is now 100 points lower at 949. But as the market has risen, they haven’t increased their expectations yet, so they are now just looking for another 4.19% gain through the end of the year.
“UBS and JP Morgan remain the most bullish of the bunch with a target of 1,100. And four strategists have price targets below the current level of the S&P 500, with Barclays the most bearish at 757. At the start of the year, Barclays was looking for 874.”
Source: Bespoke, May 19, 2009.
Jeffrey Saut (Raymond James): A stoopers’ market
” … our sense is the equity markets are forming at least a near- to intermediate-term TOP and we are cautious. As Sy Harding writes, ‘Our Seasonal Timing Strategy is now in its unfavorable season. Our non-seasonal Market Timing Strategy is now on a new sell signal (as of the close on May 13). We remain on the recent buy signal for gold; and, remain neutral on bonds.’
“Indeed, over the past few weeks technology, retail, housing, and cyclicals have broken their relative strength uptrends that have been intact since the March lows. Whether this turns out to be just another shallow correction, or something more enduring, will likely be determined by those groups whose relative strength still remains intact. Such groups include financials, agriculture, chemicals, oil drillers, and emerging markets.
“We continue to favor emerging/frontier markets and as ISI’s Francois Trahan notes, ‘If you are bullish on US equities, global stock markets have become more correlated over the past decade. And, generally when the S&P 500 has risen it has underperformed the global equity complex.’ Obviously, we agree …”
Source: Jeffrey Saut, Raymond James, May 21, 2008.
David Fuller (Fullermoney): Substantiating bullish bias for equities
“I have described conditions as being more bullish than bearish for a number of months. However such claims need to be substantiated by technical (market) evidence, which is best monitored every day.
“I will review the process, discussed at length in Fullermoney, in what can be a template for subscribers, not only for today’s environment but also the transition from every other bear to bull market in future:
“Climactic capitulation - Bear markets usually end in climactic fashion, which is the phase of greatest capitulation and despondency. This is what happened late last October and also in November.
“Base building - The most persistent capitulation stage marks the beginning of the end for the bear market, which by definition, must also be the beginning of the new bull market, although all one may see for some months will be ranging, including some new lows by indices for less fundamentally attractive markets, but also rising lows by indices for the next bull market’s leaders.
“Reversion to the mean - If the bear really is ending or over, you will see the evidence accumulate in several ways, which are different from the redistribution bear market rallies which occur on the way down. Mean reversion (we use the 200-day moving average to measure this because it is a widely followed medium to somewhat longer-term trend smoothing device) will become evident due to a combination of different developments.
“Uptrends are established - Indices will be breaking up out of their ranging bases, with the best performers establishing step sequence uptrends, one above the other. These will eventually break above the 200-day MAs, which will eventually turn upwards sometime later. The rising MA becomes a potential support level during minor mean reversions throughout the duration of the new uptrend.
“Summary - Perspective is gained by monitoring many indices, as there will inevitably be leaders and laggards. This is Fullermoney’s commonality approach. For instance, if stock market indices are mostly ranging but downward breaks are no longer being maintained, in contrast to some rallies which are being extended, one does not need to be a genius to deduce that demand (buying pressure) is beginning to exceed supply (selling pressure).
“The performance of upside leaders when looking for evidence of market bottoms and recovery potential is much more important than focussing on laggards, because we are looking for a transition from bear, which includes all stock market indices in its latter stages, to bull in which case markets will break away from the prior downtrend one by one over time.”
Source: David Fuller, Fullermoney, May 18, 2009.
SmartMoney: Why Jeremy Grantham changed his mind
“If people had paid attention to veteran investor Jeremy Grantham over the past two years, their investment portfolios would be looking much better than they likely are. While many investors were caught up in bull-market euphoria in 2007, Grantham, who oversees $85 billion for Boston-based institutional money-management firm GMO, told anyone who would listen there was a global bubble: ‘It’s everywhere, in everything’. Then, in early March of this year, when the market looked its worst, he wrote that people needed to get over their fears and invest, because US stocks were cheap and foreign stocks even cheaper.”
Click here for the full article.
Source: Russell Pearlman and Jonathan Dahl, SmartMoney, May 21, 2009.
By Dr Prieur du Plessis
Dr Prieur du Plessis is an investment professional with 25 years' experience in investment research and portfolio management.
More than 1200 of his articles on investment-related topics have been published in various regular newspaper, journal and Internet columns (including his blog, Investment Postcards from Cape Town : www.investmentpostcards.com ). He has also published a book, Financial Basics: Investment.
Prieur is chairman and principal shareholder of South African-based Plexus Asset Management , which he founded in 1995. The group conducts investment management, investment consulting, private equity and real estate activities in South Africa and other African countries.
Plexus is the South African partner of John Mauldin , Dallas-based author of the popular Thoughts from the Frontline newsletter, and also has an exclusive licensing agreement with California-based Research Affiliates for managing and distributing its enhanced Fundamental Index™ methodology in the Pan-African area.
Prieur is 53 years old and live with his wife, television producer and presenter Isabel Verwey, and two children in Cape Town , South Africa . His leisure activities include long-distance running, traveling, reading and motor-cycling.
Copyright © 2009 by Prieur du Plessis - All rights reserved.
Disclaimer: The above is a matter of opinion and is not intended as investment advice. Information and analysis above are derived from sources and utilizing methods believed reliable, but we cannot accept responsibility for any trading losses you may incur as a result of this analysis. Do your own due diligence.
Prieur du Plessis Archive |
© 2005-2022 http://www.MarketOracle.co.uk - The Market Oracle is a FREE Daily Financial Markets Analysis & Forecasting online publication.


