


Elliott Wave Theory Based Trading Into and out-of the Stock Market March 2009 Low
Stock-Markets / Economic Theory May 30, 2009 - 10:33 AM GMTBy: Joseph_Russo

 We trust that all those who have engaged in trading markets for any period of time will conclude that it is an unrealistic expectation that any single or group of trading strategies can work to perfection all of the time. Price action is elusive more often than not. As a result, losses are a most assured and inevitable part of the entire trading process. However, unwelcomed but anticipated nonetheless, cumulative debilitating losses need not dominate ones trading experience. Similar to a professional baseball player’s batting average, highly successful trading strategies need only perform with consistency a small percentage of the time in order to deliver phenomenal benchmarked measures of success.
Strategic Review
Those familiar with our work are well aware that our analysis sets forth trading strategies that address markets from five specific levels of engagement. Each of these levels addresses different timeframes, trading preferences, objectives, and styles. Naturally, the most dominant (Level- I) carries the highest weighting as it represents the largest bets on directional bias. Level-II encompasses the prudent hedging and enhancement on those largest of bets. Levels III through V are shorter-term, more active, ancillary strategies that take commensurately smaller bets on near term moves as well as daily price fluctuations. One may visit the article link highlighted within this paragraph for a more thorough discussion on each of these proprietary levels of engagement.
Level-III trading guidance
Following a short introduction and brief digression in attempt at demystifying Elliott Wave theory, the balance of this article provides an actual accounting of our ancillary level-III trading guidance for the Dow Jones Industrial Average as it plummeted and recovered sharply from its March lows.
To preface this near-perfect trading journey, we remind readers that as we begin recounting this period, the Dow had just completed an impressive 21% rebound rally off the 7450 November low culminating at the 9088 print high in January.
Shortly thereafter, we all witnessed the Dow ring in the New Year with a 1000-pt (11%) January slide in retesting the 8000 level. It was then that we began to prepare traders to enter the short side of the market at Level-III. The following real-time account reveals precisely how we go about the business of delivering our service on a day-to-day basis, and exactly how we traded into and out-of this historic period in market history.
A rather striking accomplishment in this harsh, unforgiving, and volatile arena
We would like to mention one last thing before we really get started. Since launching our forecasting service nearly four years ago in October of 2005, an astounding 97% of subscribers report that on balance, they have never lost money following our market guidance. With that impressive and well-deserved “plug” out of the way, we can now go on to show you why the overwhelming majority of our loyal clients remain consistently in the black.
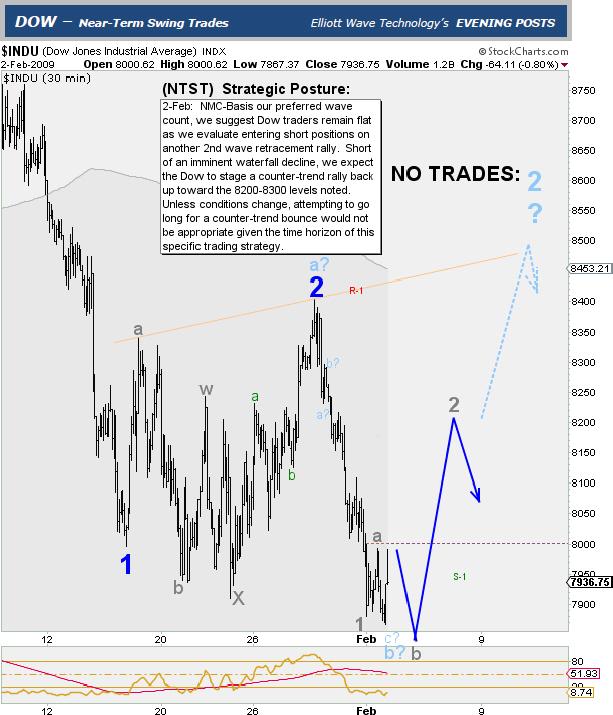
Monday February 2, 2009
Introduction
As readers can see in the above chart, just prior to 20-January, the Dow quickly began to stabilize upon the sudden and rapid test of the 8000 level. From this initial wave-1 low in mid-January, the Dow would subsequently embark upon a month’s worth of manic rallies and diabolic declines in what ultimately turned out to be a double-three W, X, Y complex correction in finally terminating its 2nd wave advance.
In assessing the above chart as of 2-February, we had no way of knowing precisely how wave-2 up would play out. We had nothing to rely upon other than our real-time interpretation of the price action in concert with a premeditated Level-III strategic plan to initiate low-risk counter trend short positions on corrective rally attempts.
In reading through each of our daily summary recaps posted directly on each price chart, readers can begin to sense our discipline in allowing the market to move within its natural rhythms both prior to and after taking a stand.
It is contextually essential to bear in mind that all tactics presented are in accordance with the trading protocol associated specifically with our Level-III trading strategy. In addition, readers can take note of how we graphically outline potential price paths that would confirm, modify, or negate our forward interpretation of price action relative to the 30-minute price bar data unfolding with each passing day.
One of the ancillary objectives of this article is to strip away the magic and mystery associated with technical analysis in general, and more specifically, Elliott Wave Theory. In demystifying countless codes and magical waves, the following account will exemplify the effective use of technical tools combined with specific real-time trading disciplines. It will further illuminate the challenges of trade management, and reveal how we continually relay prudent, safe, and profitable solutions in solving one of humankind’s most diabolic puzzles, the financial markets.
Demystifying the Elliott Wave Principle
The principles of Elliott Wave Theory stand alone as the most brilliant compilation of identifiable dynamic labeling solutions from which to piece together, and anticipate the potential ordering of events relative to the historic and future progress and regress of humankind’s endeavors as reflected in the fluctuating value of data points recorded in broad based financial indices. Whew- we barely got that out in one breath.
More simply put, objective mastery of Elliott Wave theory provides those who possess it, with the ultimate puzzle-solvers tool-kit in effectively solving the otherwise unsolvable ever-changing puzzles known as the financial markets.
The theory’s concise impartial tenets serve as the only rational way to grasp with clear distinction, the irrational diabolic movements historically inherent throughout the entire financial sphere.
Generally applied in hindsight by most, only those possessing a high level of mastery of the theory are best suited to prognosticate status of wave progressions in real-time. The extreme challenge in forecasting real-time wave dynamics rests with the large number of variant possibilities that reside between one wave terminal and the next.
The graphic below lists each of the nine degrees of trend vertically, and lists horizontally, each of the 14 plausible waves that may occur within each of the nine degrees of trend. In total, 126 plausible waves could populate a Grand Supercycle.
Far more than 126 waves could easily unfold should strings of complex double and triple-three corrections connect themselves across both the corrective and impulsive subdividing landscapes, which make up the near endless array of branching fractals, which create the sequential wave structures that comprise the larger evolving mass.
The 126 labels contain no magic, no codes, and no mystery; they are merely an array of potential anticipatory label solutions possessing incredible flexibility for arrangement in providing the only method by which to sequentially document, anticipate, and solve one of the most highly complex dynamic puzzles created by humankind, the financial markets.
126 plausible wave label solutions

14-wave possibilities @ 9 degrees of trend
The more closely one observes the smaller degrees of trend in action, (30-minute bars vs. a monthly or yearly bar chart) the more difficult it can become to make accurate real-time status assessments. As the smaller-degree waves unfold, they form a series of progressions, which may at times appear to thrash about with manic randomness, but eventually culminate a final order that will fulfill the next clear meaningful wave terminal at one or more larger degrees of trend. Assuming one is working from a plausible count hierarchy to start with, an astute mastery of variable deduction then empowers the analyst to effectively project the potential Elliott Wave variants in real-time.
Unparalleled Guidance
As an aside, it is our view that top-notch forecasting guidance should continually alert traders as to what is most likely to occur and what CAN happen next vs. potentially lulling followers into a false sense of complacency, which implies the guidance contains a bankable level of certainty as to precisely what WILL happen next. We adhere to providing the former as anything that resembles the latter amounts to nothing more than a cruel roll-of-the-dice hoax.
We admit that at times, that it can appear somewhat magical and uncanny how the market seems to follow our projected price paths and target numbers, but we assure you that we do NOT have monopoly on absolute certainty or any special insider foreknowledge. What we do posses is a rather a firm grasp of market behavior and future price path probabilities based on our mastery of Elliott Wave and chart analysis.
Not only do we disperse this highly relevant and vital information upon 30-minute price bars on a daily basis, but we also provide intermediate and longer term forecast probability studies on monthly and yearly bar charts, which contain hundreds and thousands of years of price data.
As if constant guidance of this depth and caliber were not enough of a trader’s goldmine, we take matters one-step further. We then provide clients with a battery of trading orders to time the market for optimal entry.
Wait, there’s more
Not only do we provide strategic guidance for optimal entries, but we also suggest initial stop loss placement if the orders recommended elect.
If that is not enough spoon-feeding to satiate one’s trading appetite, we further assist in the management of positions once a trade is “on”. Trade management includes trailing stop order recommendations as well as profit taking exit orders once satisfactory price and profit objectives occur.
Traders Paradise
The following succession of real-time subscriber charts, were the actual day-to-day spoon-fed (LEVEL-III) content received by clients. We exclusively convey all pertinent subscriber content directly upon each price chart. All other text within this article is our contextual post summary observations. One might view the entire account as an oasis of disciplined wisdom, tactical trading guidance, and objective resolve.
Getting a sense of the Real Thing
If one so chooses, they may first carefully study the charts and read only the comments noted on each. Doing so will best replicate the information and instruction that subscribers received in real-time. Thereafter, one may go back and read the balance of commentary surrounding the charts, which offers an insightful review of the entire process. With our digression and introduction complete, let the games begin. Do enjoy.
Tuesday February 3, 2009 - SELL ORDERS -
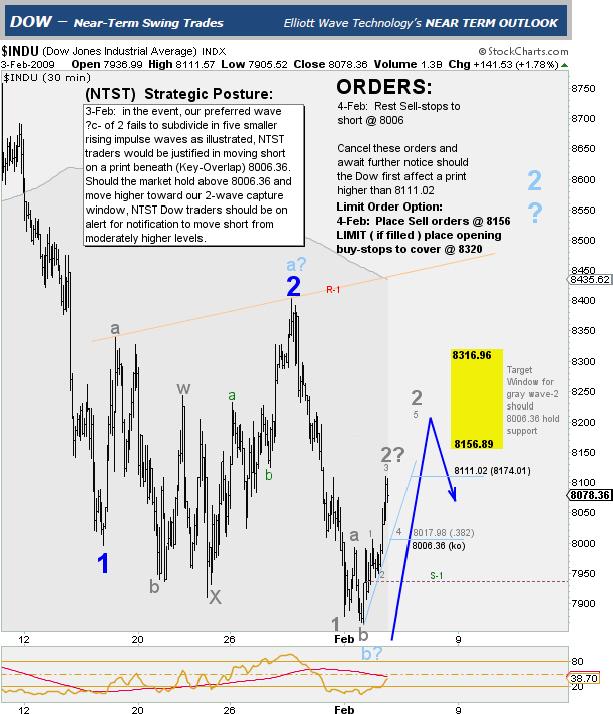
The chart above picks up our account following the close on 3-February, which highlights ORDER GUIDANCE OPTIONS to short the Dow on Wednesday 4-February. SELL @ 8006 STOP / and/or SELL @ 8156 LIMIT.
Enduring Success is No Accident / Luck plays a very small role for those Disciplined and Prepared
The 4-February chart below shows that the 8006 sell stop instruction cancelled, but the 8156 limit order to sell elected. Optimal entry was attained just 6-pts from the session high of 8162.
After (magically?) rallying sharply into the hands of our resting SELL ORDERS, the Dow then went on to close the session down 1.15% or 121.70-pts. With more than 100-pts in open profit by the close, we recommended that traders tighten their initial buy-stops to cover at 8163. Given our optimal entry @ 8156 along with the good fortune of a downward reversal to our favor, in tightening stops, we reflexively attempt to protect the trade and reduce our upside risk exposure.
Wednesday February 4, 2009 - 1st SELL ORDER FILLED -
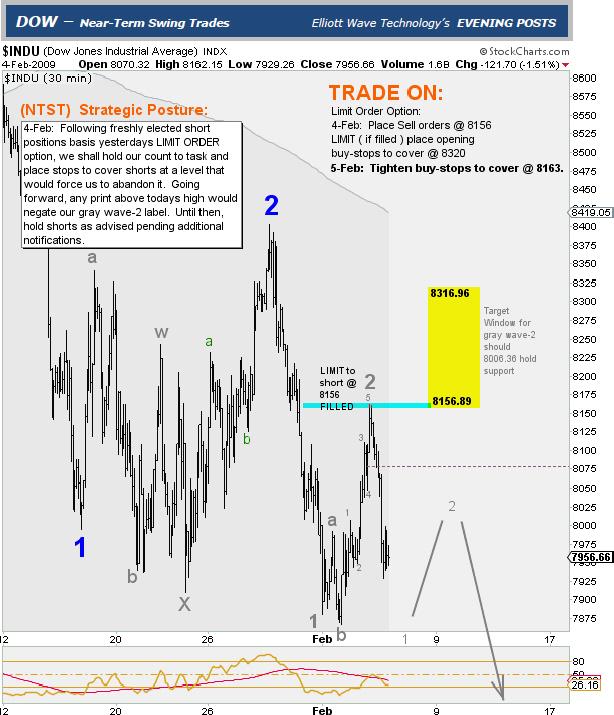
Heading into the next session short from 8156 with a protective buy-stop to cover @ 8163, the chart above provides a projected price path that would confirm our stance. However, what actually takes place on 5-February changes things dramatically. As you will soon see, what appears to be a mystical short position fill right at the highs of the session, takes on a completely new dimension in the days ahead. Welcome to the jungle dear readers.
Thursday February 5, 2009
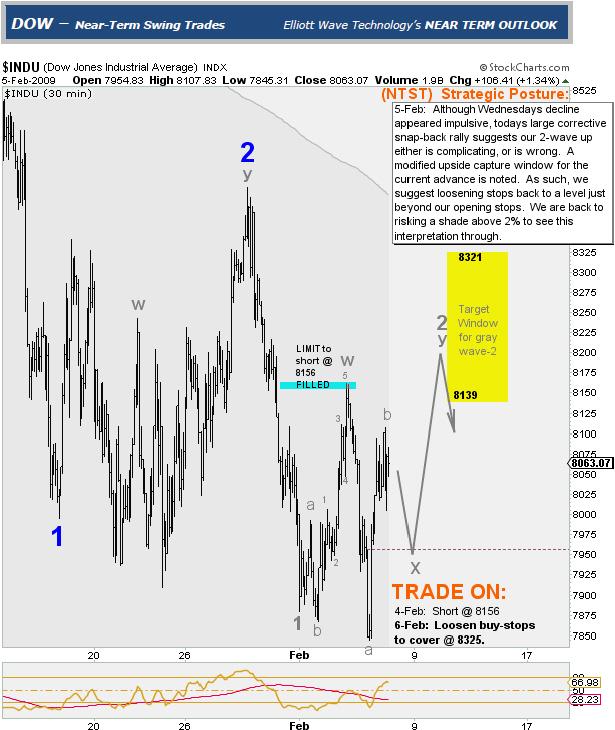
After a rather sharp fall at the 5-Feburay open, the market staged a 300-pt diabolic rally thrust that would place our once profitable short position in jeopardy of stopping out for a loss. As noted in the chart summary text, this large rally suggested that our subdividing gray wave-2 had not yet finished wrecking havoc on newly acquired short positions. So far, all we are witnessing is pure defiance, as the market is by no means yielding to our magical wave count commands.
As the strong and disciplined rise to a heightened sense of alert, the game is on as we begin treading through some very rough terrain toward our unknown destiny, leaving those too fearful to face the prospect of uncertainty and loss behind us.
In addition, as noted beneath the trade status instructions listed on the chart, we were compelled to loosen buy-stops to cover, and in doing so, re-assume a shade above our initial risk parameter of 2%. What a difference a day makes. We are now where all traders ultimately wind up, smack in the real world trenches of the emotionally charged trading battlefield. Forward we march.
With the new data points in place, we now prepare for a continued move higher into our yellow price target window, which spans the 8139-8321 levels. Now committed to the short side of the market, readers should note how we sternly avoid emotion, and diligently maintain disciplined trading protocols specific to Level-III in seeing this interpretation through.
The next trading session would challenge our stance considerably, and place our short positions in a substantial state of drawdown, and at heightened risk of stopping out for a modest 2% loss. Win, lose, or draw, we must manage our positions according to strategic protocol. Trusting our disciplines, we accept our fate, so bring it on.
Assessing Expectations
One can never expect, let alone insist upon forecast certainty amid one of the most fragile, dynamic, and diabolic inventions of fear and greed ever created and cunningly manipulated by the highest power brokers in the land.
Friday February 6, 2009
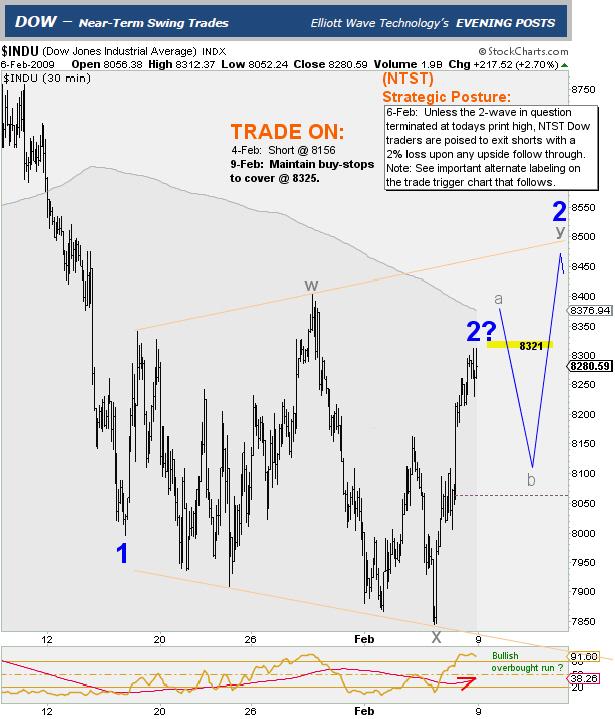
As it is in life, so it is in trading. Ups and downs will occur with certainty, and at times, with alarming frequency. Rest assured there will be good periods and bad periods. One’s reaction, and how one adapts to such periods is what makes all the difference in both the quality of one’s life and success in one’s trading.
Relative to our recently elected short positions, the 200-pt rally in the chart above depicts one of those very bad days. The high for the session was 8312, which stood just 13-pts away from our stop loss.
Note how we dynamically adjust the corrective -W- and –X- wave subdivisions, and more specifically, the blue 2-wave in question that will mark the end of this complex corrective reign.
This -2- wave terminal location is what we as short-sellers “wish” would be, however in preparing for a contingent reality; we objectively project a path of what CAN happen instead. Namely, that the Dow could experience another down/up sequence in terminating the larger 2-wave in question well above our stop loss levels.
No magic, no codes, just pure unadulterated prudent speculation ground in discipline, and based upon the highest probabilities of what is most likely to next occur, and the willingness to accept the fate of all possible outcomes. It is that simple.
It is impossible for most to maintain the discipline to see ones actions through, and to embrace the fact that trading is a two-way street to which over time, the winners end up with more profit and significantly less in cumulative losses vs. those who amass more losses vs. profit amid the cumulative ongoing tally of each zero-sum transaction.
“Win or lose, it is our responsibility to assist traders in the maintenance of such disciplines.”
“Those who quickly give up when sound trading tactics bring modest disappointments fail to see the larger picture.”
Those with such limited patience are destined to lose the majority of their trading equity. The probabilities are high that their short sightedness will never allow them to learn the true meaning of sustainable long-term success in the trading arena.
In fact, these are the traders whom the winners make their living from, and we thank them very much for their collective lack of wisdom in making our jobs less difficult. We would prefer however, if they would join our ranks instead, and become part of our successful disciplined trading contingent.
Monday February 9, 2009 – 2ND SELL ORDER FILLED -
+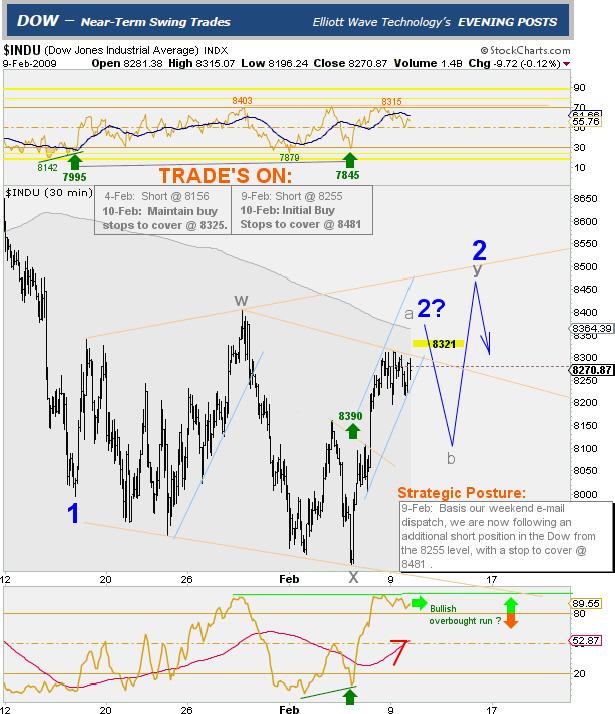
In reviewing our charts over the weekend of February 8, we asked ourselves; where in heavens name is the forthcoming third wave decline. The Dow was clearly a corrective mess of manic price fluctuations with no rhyme or reason beyond that of punishing every short-term speculative participant involved.
Sensing the market levitating on thinly borrowed time, along with the fact that the Dow dipped into our shaded “sell-mode-bias” earlier in the month, we were near-certain that the end of blue wave-2 was imminent.
On Sunday evening 8-Feb, with our initial short position from 8156 still “ON”, we recommended additional SELL-ORDERS via email prior to Mondays open. The instructions were to short the Dow upon breach of the 8255 level noted. If the market opened lower electing these new shorts, we advised traders to protect their new short positions with a buy stop to cover @ 8481.
Near the open of trade, this new ORDER FILLED. By sessions-end on 9-February, we were now managing guidance for two separate short positions in the Dow. Although the market moved to higher highs (8315) during this session, it still did not break above the 8325 stop loss on our initial short position.
In the chart above, note how our projected price paths continue to warn traders of what CAN happen in event the 2-wave in question has yet to land.
Tuesday February 10, 2009
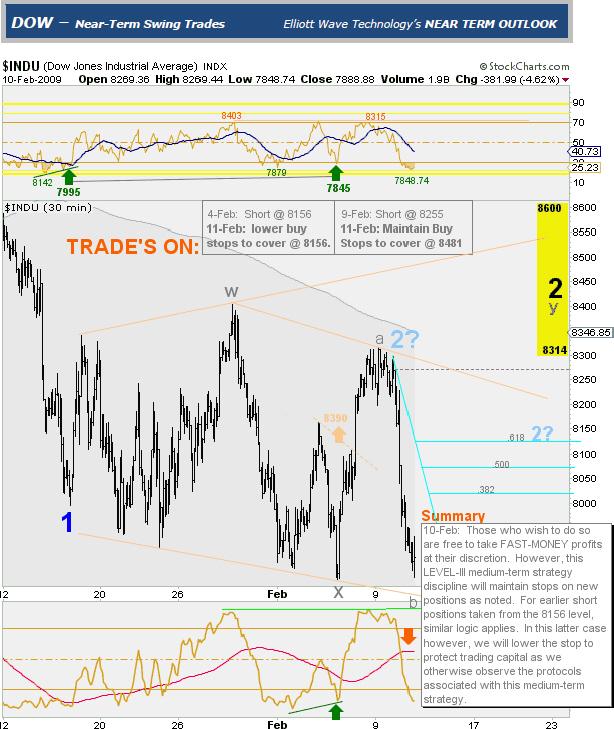
A BIG sigh of relief for those holding short positions
10-February brought with it a 4.62% / 381-pt decline in the Dow Jones Industrial Average. Ah, yes.
In addition to carefully reading each of the real-time position summaries, and trade management instructions contained on each of these price charts, readers should also take note of our intentional caution in NOT ASSUMING the 2-wave in question had indeed landed.
It is essential to maintain a sharp eye on what CAN happen that would have adverse impact on ones positions. With such adverse possibilities kept in the forefront of traders’ minds, they are less apt to put the complacent blinders on in believing that their positions are the surest thing to easy profits.
Such discipline forces traders to stay on their toes, and mentally prepare for contingency plans should their trade take a sudden turn for the worse.
Our job here at Level-III, is to maintain the appropriate discipline and resolve in managing the level-III trading protocol to the best of our ability. We continue to summarize our efforts in this task by sharing with you the real time actual price charts dispatched daily to our subscribers in order to show you precisely how we do just that.
Thursday February 12, 2009
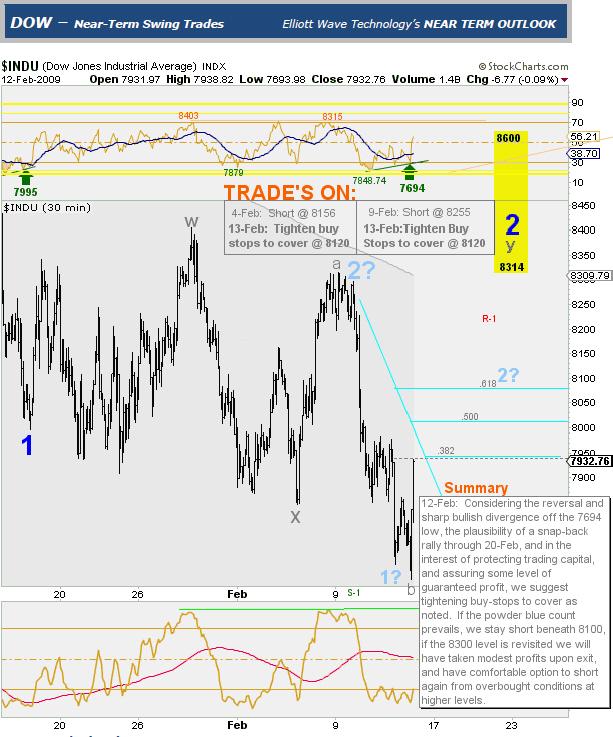
Despite the five-wave impulsive decline barely visible from the recent pivot high near 8325, note how we continue to cautiously NOT TRUST (rather than foolishly assume) that the 2-wave in question has landed. For the sake of our short positions, we HOPE that the retracements noted from 7950 through 8075 will stem any rally, but we emotionally PREPARE traders for a potential –c- of ‘y’ of “2” terminal, which can take the Dow back up to the 8314-8600 range, and which would in effect, completely annihilate the magnificent short trade currently in progress.
Enduring Success is No Accident / Luck plays a very small role for those Disciplined and Prepared
Adequately diffusing emotion via preparedness contingencies is what we consider the ultimate defense in best practice strategic speculation. Once traders apply such discipline, every outcome of every trade, whether it culminates in a profit or loss, is an unequivocal SUCCESS. With this trading philosophy, we celebrate every trade outcome as an enduring triumph. Amid every timeframe, those applying such discipline will repeatedly emerge victorious. Hmm, perhaps this is why over the past five years that 97% of our subscribers report on balance, that they have never lost money following our guidance.
Friday February 13, 2009
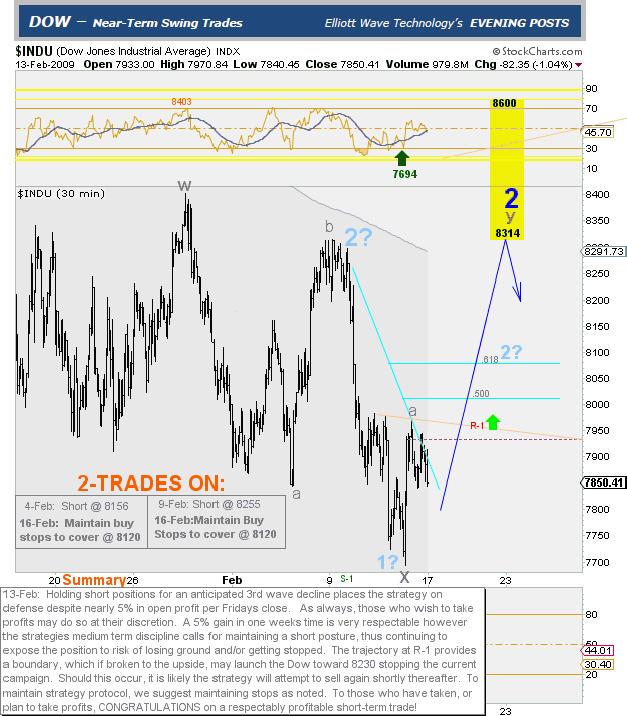
No magic, no codes, just trading the price action
By 13-February, even though the .382 retracement level is holding the rally at the 7950 level, we remain defensive in categorizing the -2-wave in question as “landed”.
It is only upon decisive breach of the 7750 level, (which will not occur until the following week) that we put a lock on the -2-wave as having “landed”.
Tuesday February 17, 2009
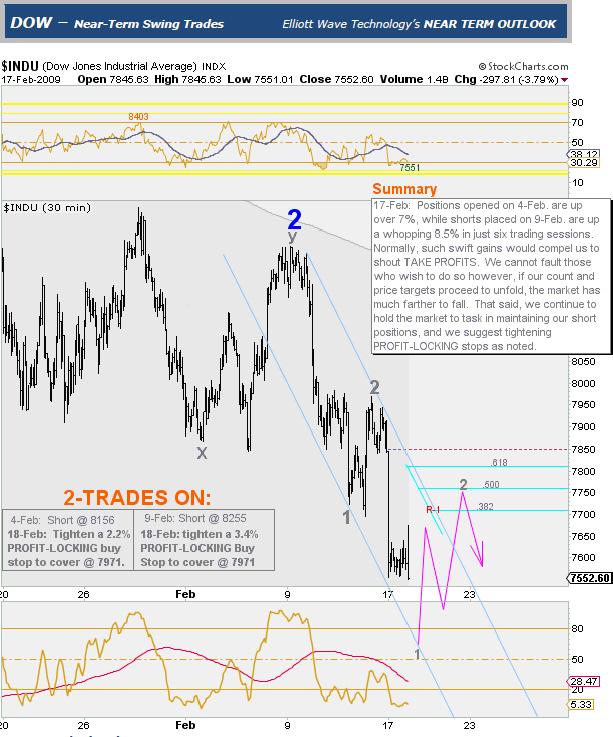
Locking in PROFITS
By 17-February, the Dow’s further 300-pt plunge has begun to confirm previous 2-wave terminals that were formerly in question. We now lock-in the blue and gray 2-waves as having landed, and advise traders to LOCK PROFITS as noted.
Readers should take note that we continue to manage this trade in accordance with strategy protocol despite the understandable appeal in taking quick profits. In doing so, readers should also understand that if the Dow were to move sharply higher and stop us out, we would WILLINGLY FORFEIT more than HALF of our open profit, and celebrate a successful trade with no regrets.
Friday February 27, 2009 - EXIT ORDERS TO COVER SHORTS -
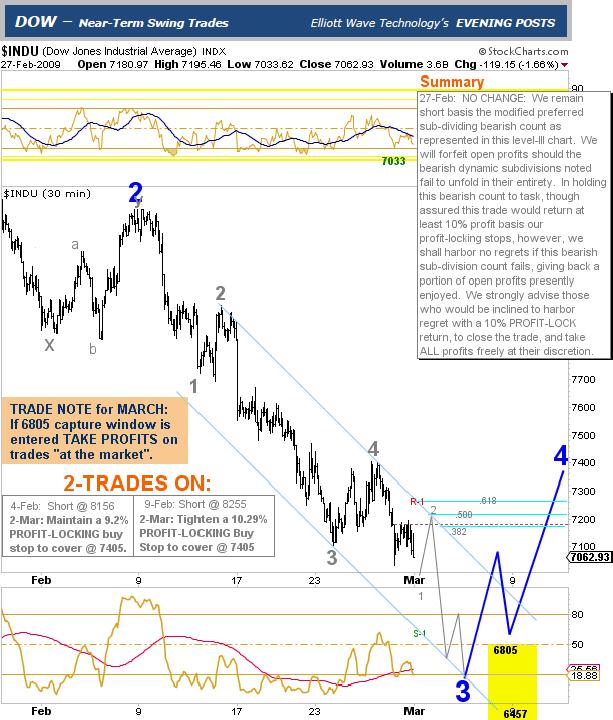
Trade Note to EXIT and TAKE PROFITS
On Friday 27-February, we issued a trade note to cover shorts at the market if the index hit our downside price objective at 6805 or lower.
TRADE CLOSED
The chart below illustrates our 6805-target captured and highlights a phenomenally profitable trade outcome. Was it luck, magic, some sort of voodoo, or a combination of skill, resolve, and strategic discipline? You decide.
Monday March 2, 2009 - COVER SHORTS / TAKE PROFITS -
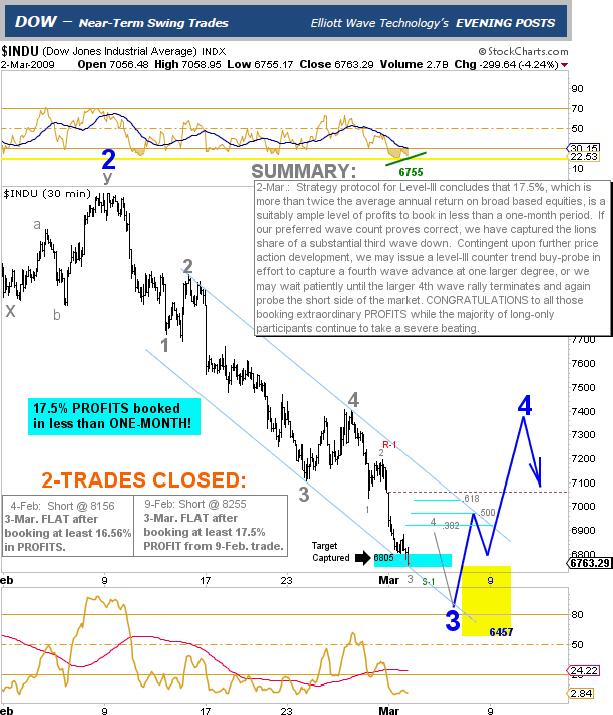
Perfection in progress
As the chart above illustrates, although we booked short side profits at 6805 we were still looking for lower prices toward the 6457 level. The chart also graphically depicts our anticipation of a very sharp upward rally that would likely follow such a low.
Thursday March 5, 2009 - BUY ORDERS -
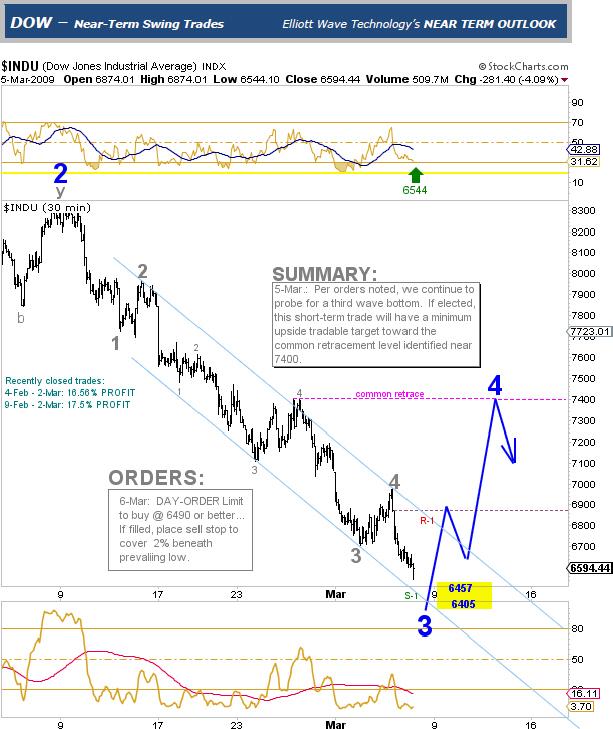
A SECOND Impending Perfection - BUY ORDERS
On Thursday 5-March, we posted trading orders for 6-March to BUY the DOW @ 6490 or better.
BACK-TO-BACK PERFECTION strikes again
On Friday 6-March, we did just that. Within 3/10ths of one percent from the absolute bottom (less than 20-pts from the March print low) we were LONG the Dow @ 6490.
By the close of trade, our new long position was already up some 136-pts or 2%. Was this also luck, magic, or was it a combination of skill, resolve, and strategic discipline? Again, you decide.
Friday March 6, 2009 - THE MARCH 2009 BOTTOM - BUY, BUY, BUY
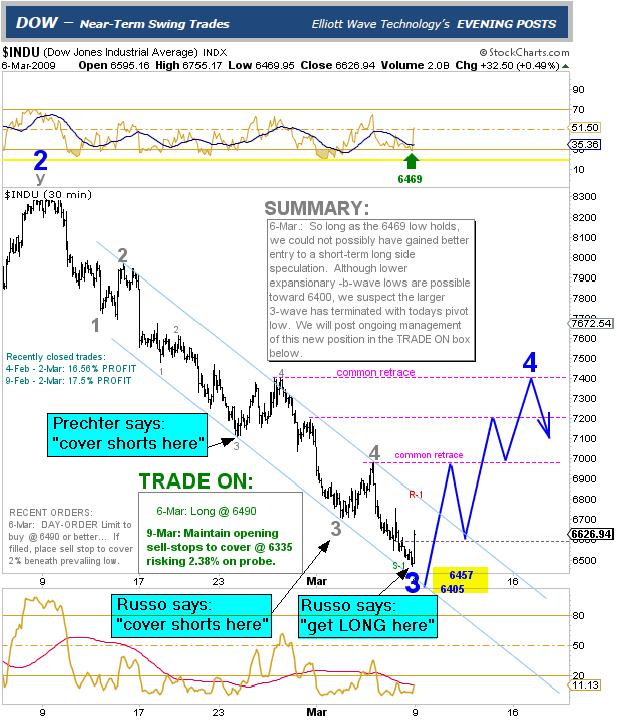
Brush with Perfection
So here we are on 6-March, after missing the last leg down in covering recent shorts at 6805 for a gain in excess of 17%, we are now long from 6490 and looking for a sharp run-up toward the 7000-7400 level.
With the sky falling, and the end of financial civilization nigh, we then by design, intentionally marshaled the audacity to extend a single hand in effort to catch the proverbial falling knife.
The relentless menacing blade must undoubtedly have impaled countless hands before our own, because by the time that razor-sharp pointy blade hit our palm, it stopped dead in its tracks with no more than a pinhole puncture wound and the residual splattering of spilt blood from those less fortunate who were attempting the same long before us.
We are now nearing the end of our near-perfect journey. Soon the bravado and tales of victory will return us back to the planning tables of our strategic disciplines. Such a return will re-ground us in fully assimilating all lessons learned from battles past, and further prepare us for the endless array of future conflicts amid the escalating war, which lays in wait until we so decide it tactically prudent to re-engage the enemy.
Friday March 13, 2009 - TAKE THE MONEY AND RUN -
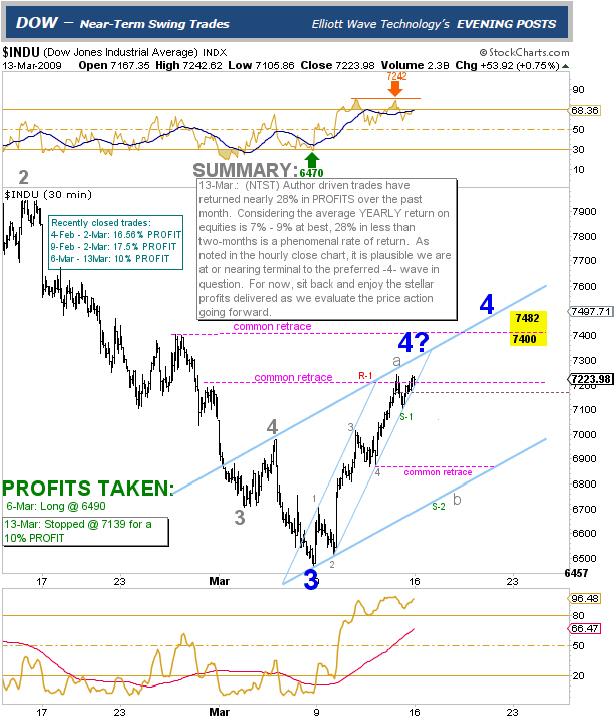
Our Brush with Perfection continues
On 12-March, nearing a first common retracement level for wave-4 in the 7200 area, we advised traders to lock in 10% profits with a tight trailing sell stop @ 7139. On Friday March 13th, the chart above illustrates those tight sell-stops firing amid the 7105 session low. Content that we took our fast upside profits at or near the preferred 4-wave terminal, we now lay in wait for evidence of its confirmed conclusion. Unfortunately, at the time, we did not realize that we would be waiting for Godot.
Perfection eludes us… ongoing Success does not
Though absolute perfection indeed eluded us at that juncture, there is simply no denying the astounding level of our success and competence in serving up solid navigational trading guidance throughout this historic period in market history.
Coming Clean
As readers may expect, we had a flood of new subscribers wishing to hop on board our gravy train to easy profits. We are proud to say that though some quickly lost patience and jumped ship when double-digit weekly profits failed to occur like ponzi-scheme clockwork, the majority of new clientele remains steadfast with loyalty in our interpretation, handling, and management of the diabolic V-shape rally off the March low.
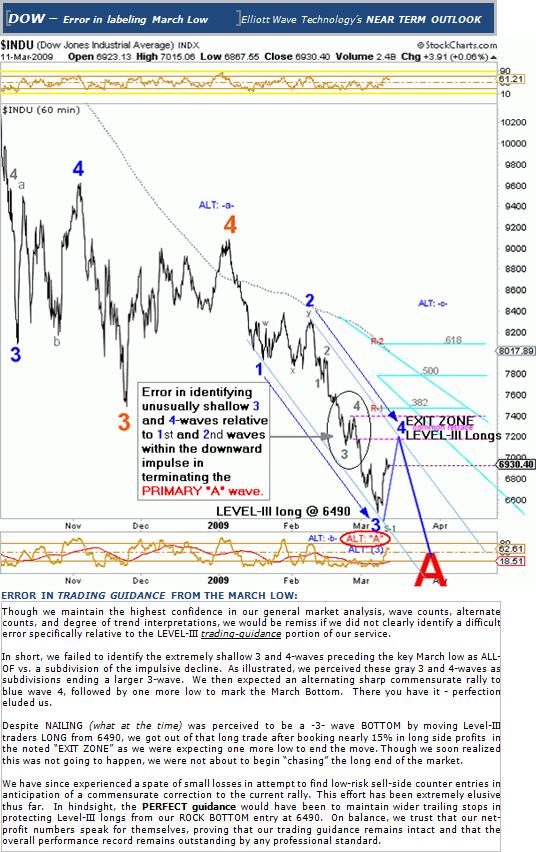
Where we strayed from strategic discipline
By now, it must be obvious to readers where perfection clandestinely eluded us. That large blue 3-wave labeled at the low in the chart above is clearly the elephant in the room.
As we will explain in full detail below, we were caught off guard when the Dow kept on rising without pause, first past 7200, and then past the 7400 level. Given that our preferred wave counts were unfolding with absolute perfection, it was not until the Dow continued its unabated levitation above the 7400-level that we reversed course and adopted favor to our standing alternate count. This was a great example of how we change our minds when dynamically adjusting key wave count terminals; we wait for the price action to prove it.
Failure to incorporate the resting alternate count into our strategic trading tactics
In hindsight, the unfortunate result to what we should have alternately anticipated caused us to take profits on long positions too early. Instead of adequately respecting the plausibility of our resting alternate count, we narrowed our vision a bit too much in anticipation of an impending downside 4th wave reversal, and we made the tactical error of protecting long positions too tightly.
The result was a 10% profit on what was undeniably a SECOND perfect trade turned bad. The correct strategy would have been to trail exit stops more generously, allowing the market sufficient room to move rather than making an improper tactical assumption that our preferred wave count was the only possible path the market could take.
This was a classic case of not factoring in ones viable alternate wave count into the strategic deployment of trading tactics. Despite this, we have no regrets, and neither do our trading accounts, which are still brimming with bounty from decisive victory. Since we are not going anywhere, and we have plenty of dry powder to go around, might you care to join our forces despite the occasional flaws?
The chart and text below sums up for subscribers, precisely how, where, and why an absolute back-to-back encounter with twice-perfection escaped our stronghold.
Chart and commentary highlighting error to perceive sustainable low
Readers may review a more brazen account for the S&P here. We hope that you have enjoyed this account of disciplined real world trading with plan and purpose. Our doors remain open for those who wish to match their wit and trading acumen against our own, and to those who seek a steady and rational hand in evaluating and managing their current bias and financial expression in the major indices.
Assuring Safe and Profitable Outcomes
We are the “Simplicity Experts” of navigation amid the broad equity markets. Our well-organized visual approach in chart presentation incorporates a disciplined blend of technical best practices. This presentation framework enables us to translate, organize, and simplify (BY STRATEGIC LEVEL) the otherwise complex, and challenging tasks inherent in navigating safely throughout the entire speculative process. The result is our NEAR TERM OUTLOOK, a simple but comprehensive trading publication, which provides clients with prudently actionable speculative guidance amid all time horizons.
 Trade the Supercycle IV -Wave
The express focus of Elliott Wave Technology's Near Term Outlook is to help active traders anticipate price direction and amplitude of broad market indices over the short, intermediate, and long-term.
Communications ‘09: To more effectively convey dynamic trading conditions relevant to our technical publications; we have recently launched complimentary E-briefings for anyone interested in following our work. E-brief dispatches will summarize current market conditions and tactical trading postures across various time horizons and trading strategies. Those interested can obtain free-inclusion from the sign-up block on our homepage.
Trade Better / Invest Smarter...
By Joseph Russo
Chief Editor and Technical Analyst
Elliott Wave Technology
Email Author
Copyright © 2009 Elliott Wave Technology. All Rights Reserved.
Joseph Russo, presently the Publisher and Chief Market analyst for Elliott Wave Technology, has been studying Elliott Wave Theory, and the Technical Analysis of Financial Markets since 1991 and currently maintains active member status in the "Market Technicians Association." Joe continues to expand his body of knowledge through the MTA's accredited CMT program.
Joseph Russo Archive |
© 2005-2022 http://www.MarketOracle.co.uk - The Market Oracle is a FREE Daily Financial Markets Analysis & Forecasting online publication.