


Gold Continues its Strong Drive Higher
Commodities / Gold & Silver 2009 May 31, 2009 - 10:29 AM GMTBy: Merv_Burak

 Well, which is the driving force, the U.S. $ plunge or the gold price rise? Who cares as long as gold is on the rise, right? There still are a couple of resistance levels for gold to overcome but they may not be all that serious.
GOLD
LONG TERM - Just a quick word about the U.S. $. It closed on Friday at 79.43 which was a close below the December low close but not below the December intraday low. So, it depends upon if one is looking at the intraday low or the closing low to see if the $ has broken below the previous “low” for a double top confirmation and a move to the 68.00 level as mentioned last week. Another down day for the $ and both lows will probably be breached with the question unimportant, but for today I would still like to see the close at below the previous intraday low for confirmation.
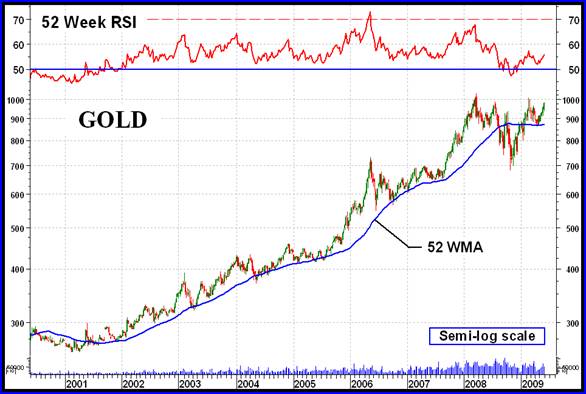
The chart today is what I refer to as my very long term chart. It includes a 52 week RSI and a 52 week simple moving average line. I wouldn’t go into any detail analysis of this chart (I think I had done that some time back) suffice it to say that BOTH the RSI and the price/moving average are in sync on the bullish side. For me to go bullish or bearish on the very long term I like both of these indicators to be telling me the same story. The price should be above a positive sloping moving average line and the RSI should be inside its positive zone (above the 50% level). The reverse is true for a bear market. During times when both are not in sync we have a neutral trend. It could be a + neutral coming off a bull trend or a – neutral coming off a bear trend.
Late last year both indicators were in sync, on the down side for a very long term BEAR rating, the first bear since the bull took hold in 2001. However, in late April both indicators had reversed back to the up side for a very long term BULL rating. That’s where the very long term stands, once more.
Going back to my normal long term indicators, everything is still looking good. The price is above its positive sloping moving average line and the momentum indicator is inside its positive zone above its positive trigger line. As for the volume indicator, it continues to move upward above its positive trigger line. The long term rating remains BULLISH.
INTERMEDIATE TERM
No surprises here, the intermediate term continues on its way to higher levels. The price is above its positive moving average line and the momentum indicator continues to push higher inside its positive zone. The indicator also continues to move above its positive trigger line. The volume indicator continues positively above its positive trigger line. On the intermediate term gold remains BULLISH.
SHORT TERM
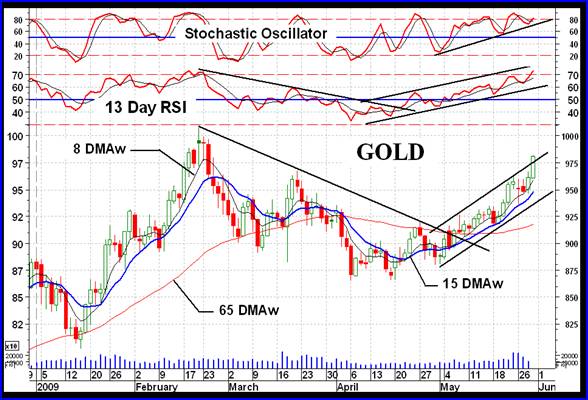
I guess I went a little overboard with drawing trend lines today but what the heck, each line tells a story. I’ll leave it up to the reader to try and decipher each story for themselves. Just remember that once you have a well defined trend line its breaking is telling us something. Also, the momentum trend line, when we have one, is most important and usually slightly ahead of the price trend.
On the short term everything smells roses. The price and various indicators are above their trend lines and positive moving average lines. The volume activity is starting to perk up on the up side. The very short term moving average line continues to trace higher levels above the short term moving average line. The short term rating can only be BULLISH.
The immediate direction of least resistance is to the up side but caution has already been noted. Both the short term momentum indicator and the aggressive Stochastic Oscillator have entered their overbought zone. That is a warning that a possible end on the up side may not be far ahead. It may only be a rest or a short reaction but something can be expected to halt the latest upside move. When? That is not yet eminent.
SILVER
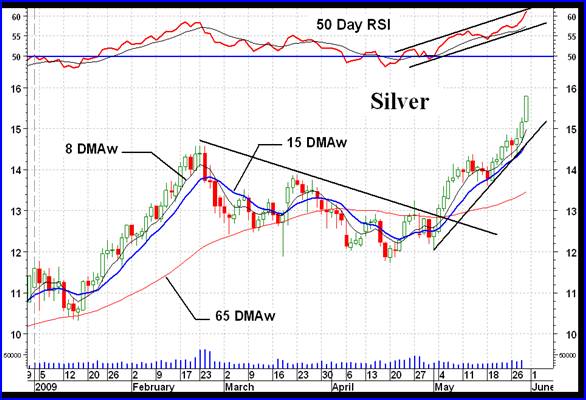
Up, up and away. Quite a difference between the recent silver action and that of gold. Gold has not yet exceeded its February high while silver has taken off well above its similar high. Silver, however, still has a long way to go to reach its previous 2008 high of $21.50. The volume indicator, however, is well into new all time highs. Looking at my table of Non-Edibles Futures Indices silver has the number 1 performance over the past long term (200 days) and the number 2 performance in the short term (15 days). Only in the intermediate term has it stumbled somewhat and let the other non-edibles take over. It is only number 15 out of 26 non-edible futures in the intermediate term (50 days). Oil is the number 1 performer on the short and intermediate term.
It should be obvious without any analysis that the silver rating is BULLISH for all three time periods and that the immediate direction of least resistance is to the up side. The only cautionary indication is the fact that both the short term momentum and the aggressive Stochastic Oscillator are in their overbought zone and may start to dampen further upside action until after silver has taken a rest to consolidate gains.
PRECIOUS METAL STOCKS
As long time readers to these commentaries know, I use only simple technical techniques in my weekly analysis. I do the same in my weekly service relative to stocks. Now, I so often come across “investors” who claim that they find the technical discipline very hard to follow and use. Most claim that it just doesn’t work. Well, in a matter of a few simple paragraphs I am going to show you two different simple technical techniques that would have kept you from losing your shirt over the past year or two and had you in cash getting back in at near the bottom of a new move. To demonstrate I will use an actual stock from my universe of 160 stocks. The name has been omitted as some web sites that post these commentaries do not want commentators to name individual stocks.
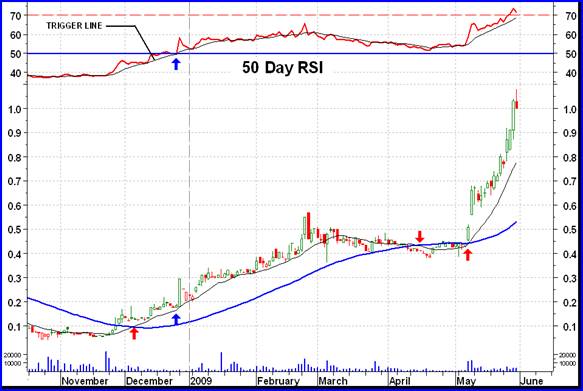
The first simple technique is the short term moving average line crossing the intermediate term moving average line. The cross over points are highlighted on the chart as red arrows. I use the 15 day weighted (not exponential) moving average (thin black line) for the short term and the 65 day weighted moving average (blue line) for the intermediate term. You will get almost the same performance by using the 10 day and 50 day simple moving averages. Note that this simple technique is not perfect (perfection is only for losers). You would have been whip-sawed in April and early May.
The second simple technique is a little more complicated but still simple. Both the intermediate term moving average line and the intermediate term momentum indicator should be in sync. For a buy the price should be above a positive sloping moving average line and the momentum should be in the positive zone (above the 50% level). For a sell the reverse is true. The price should be below a negative sloping moving average line and the momentum indicator should be in its negative zone. My preference for an intermediate term momentum indicator is a 50 day RSI. Some might use the MACD. It is a little more aggressive but still okay.
Let’s see how this worked on this stock. For the first technique we had a buy at $0.13 in early Dec, a sell at $0.41 in mid April and another buy at $0.51 in early May. The net result was more than a 400% gain from the initial buy. Not bad for 6 months of work, almost a living.
For the second technique we had an initial buy at $0.18 in late Dec and no sell yet, for a similar gain of over 400%.
Looking back at this stock it was over a $1.70 stock back in 2006. It started its decline then and had been moving lower until late last year as the chart shows. The first technique is the more volatile technique. Looking back one would have sold this stock at around the $1.60 level. There were three times during the decline where one might have bought and then sold (getting whip-sawed) based upon the very simple criteria. The loss from those transactions would have been around 30% total. No matter the technique used, you should expect that you will have losses from time to time. The experienced speculator limits the amount of losses. Let’s be conservative here and assume that for every share you sold initially at $1.60 you had only $1.00 left to invest in late 2008. With that $1.00 you could have bought over 7 shares at the buy in point. You are now holding 7 shares for every share you initially sold in 2006, worth $7.00 at the recent price. The buy and hold “investor” would still be holding that one share he initially had at the $1.70 price and now only worth $1.00.
This is a point so often missed by the masses who are wedded to this buy and hold strategy. With the buy and sell strategy you are most likely to end up with more shares costing a lot less per share. The strategy to buy extra shares on the way down does the same thing BUT who knows if that stock will in fact recover. Think General Motors here, the top “quality” a few years ago and now a bankrupt. Buy extra shares on the way down did not work too well here.
Anyway, this is just to illustrate a couple of very simple technical techniques that one can use to time his buys and sells without much work. Anyone not able to understand these simple techniques should not be in the market. And again, NO TECHNIQUE is perfect. Every technique WILL result in a loss sooner or later and one must be prepared for such losses and keep them small. I do have additional criteria that I use to try and limit the losses but that would take too long to explain here.
Merv’s Precious Metals Indices Table
Well, I think I’ll call it a week.
By Merv Burak, CMT
Hudson Aero/Systems Inc.
Technical Information Group
for Merv's Precious Metals Central
For DAILY Uranium stock commentary and WEEKLY Uranium market update check out my new Technically Uranium with Merv blog at http://techuranium.blogspot.com .
During the day Merv practices his engineering profession as a Consulting Aerospace Engineer. Once the sun goes down and night descends upon the earth Merv dons his other hat as a Chartered Market Technician ( CMT ) and tries to decipher what's going on in the securities markets. As an underground surveyor in the gold mines of Canada 's Northwest Territories in his youth, Merv has a soft spot for the gold industry and has developed several Gold Indices reflecting different aspects of the industry. As a basically lazy individual Merv's driving focus is to KEEP IT SIMPLE .
To find out more about Merv's various Gold Indices and component stocks, please visit http://preciousmetalscentral.com . There you will find samples of the Indices and their component stocks plus other publications of interest to gold investors.
Before you invest, Always check your market timing with a Qualified Professional Market Technician
Merv Burak Archive |
© 2005-2022 http://www.MarketOracle.co.uk - The Market Oracle is a FREE Daily Financial Markets Analysis & Forecasting online publication.