


Honest Money Financial Markets Wrap - Stocks, Commodities and Gold
Stock-Markets / Financial Markets May 29, 2007 - 12:21 AM GMTBy: Douglas_V_Gnazzo

Introduction
This week's market wrap is going to focus primarily on the precious metals sector. There are a lot of charts, including a couple of the dollar and bonds.
The recent prolonged correction of gold and silver has produced a good deal of angst in the pm community, as the many emails and comments I've received on my website attest.
I will attempt to address the concerns that were expressed. So let's get to it.
First up is the monthly chart of gold going back to the start of the bull market in 2001.
It shows that from Sept. 2005 to May 2006 gold rose from $450 an ounce to over $700. That's a 250 point increase (55%) in seven to eight months time. That's cruising - at high altitude.
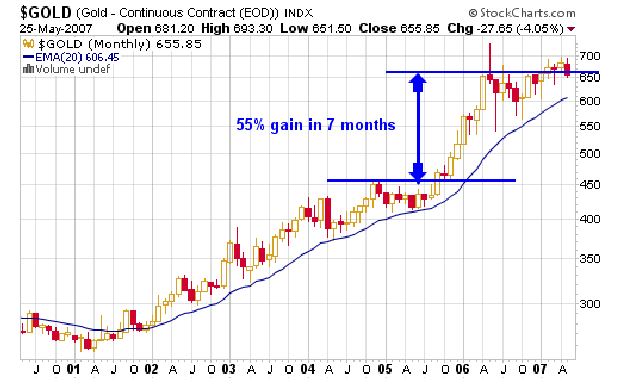
A hearty meal such as that takes time to digest, no different then a Thanksgiving Day feast.
 Since May of 2006 to the present, gold has been digesting its hearty gain. It has been about a year's time.
Due to the huge gain in such a short amount of time, the duration of the correction, which has been more sideways then down, is nothing unexpected or unusual.
Hui
Next up is the Hui Index over the same time frame. Its gain was even more spectacular.
From May of 2005 to May of 2006 (1 year) the Hui Index went from 165 to 401, a huge gain of 142% in 12 months time.
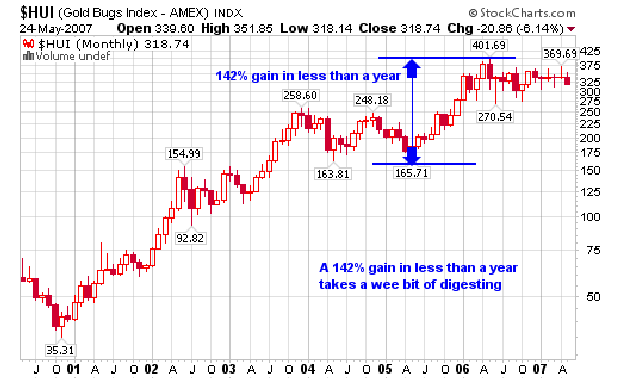
Once again, huge gains like this, especially in a relatively short time frame, require time to be digested. Such is only normal and healthy market action.
A respite is needed after a run like that - to build solid support for the next leg up.
Since May of 2006 until now the Hui has been undergoing an intermediate term correction for just over a year's time. Nothing out of the ordinary, it is standard procedure.
If it didn't happen then one should be concerned, as parabolic moves correct the same way they go up: straight up, and then straight down.
Expected
Back in October of 2006 I wrote an article titled Gold: Stage One or Two? In the article I showed the following chart and comments.
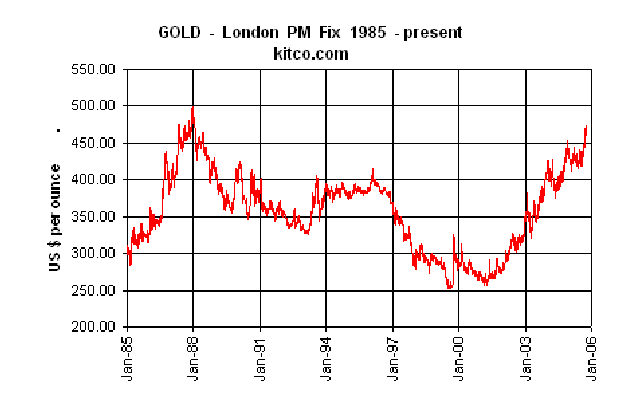
"When $500 becomes support rather than resistance - stage two will be here."
So far the $500 level has not directly been tested. That's good. It could, however, yet be challenged - or not. Time will tell.
As of now it appears the low has been put in, and is presently being tested. This is what has been recently occurring. It was expected, and it has come to pass.
In Feb. 2006 I wrote another article titled The Charts Are Talking: Is Anyone Listening? In it was the following quote:
"It is still early in the precious metals bull market. Stage two may have been entered, but then again it may not have. In Gold: Stage One or Two? It was stated that breaching the $500 level was tantamount to confirming that a true bull market was unfolding.
Now that that level has been bettered, all that remains is for a higher low to be put in place during any subsequent counter trend correction - especially if the $500 dollar level now becomes support, as opposed to resistance just prior to the breakout. If such occurs we are without question in stage two."
So this was after $500 had been bettered and gold was on its way to $700. Market sentiment at the time was giddy. As gold passed $650 we wrote another article that said:
"Call us stupid, but we are fond of selling into 52-week highs - not in buying them. In a bull market, we prefer to buy into weakness and to sell into strength."
 Stock Market vs. Gold
Next I'd like to discuss the performance of the U.S. stock market versus the precious metals market.
The Dow has been doing very well of late, making new high after new high.
The rise has been nothing short of spectacular, and I did not see it coming.
Congratulations are in order for all those who did.
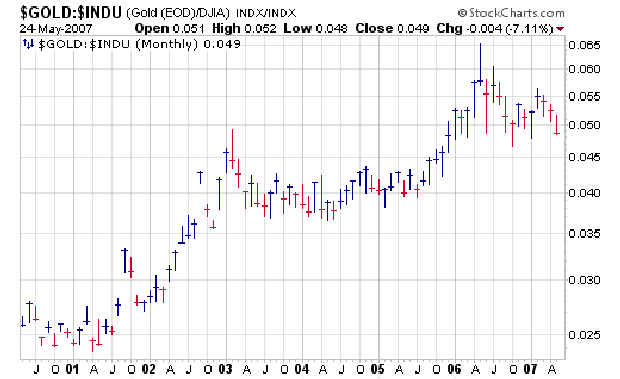
First up is a chart that compares the performance of gold to the Dow Industrials. The higher the number on the chart, the stronger is gold's performance compared to the Dow's.
The chart goes from the bottom left hand corner to the top right hand corner - a bullish signature that shows gold out performing the Dow.
Presently, there is a sidewise consolidation occurring, with a slight bias down, just as there has been a few times before.
Gold subsequently continued to out perform, after what ended up being nothing more than a slight counter trend rally by the Dow.
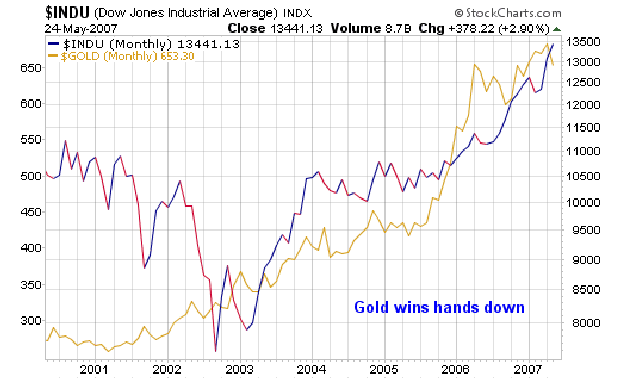
Next is a chart of the Dow with the performance of gold overlaid on top. Gold has out performed hands down.
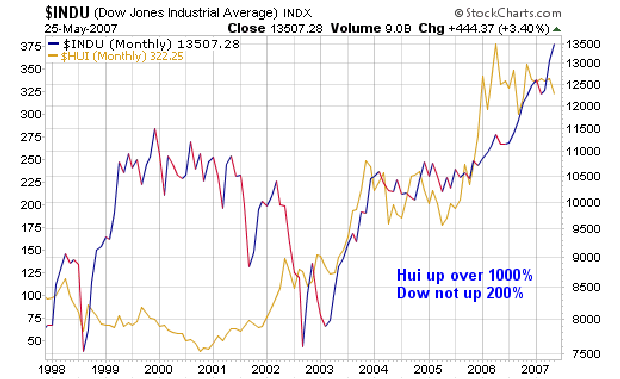
Below is a chart comparing the Hui Index to the Dow. As the chart shows the Dow is up less than 200% in the same time that the Hui is up over 1000%.
Later in the report we will show some charts of individual gold and silver stocks compared to the Dow - the results are even more impressive then that of the Hui.
Bonds & US Dollar
Before moving on to gold, silver, and the precious metal stock indexes, we want to show a chart or two of bonds and the U.S. Dollar, as both can affect the pm's.
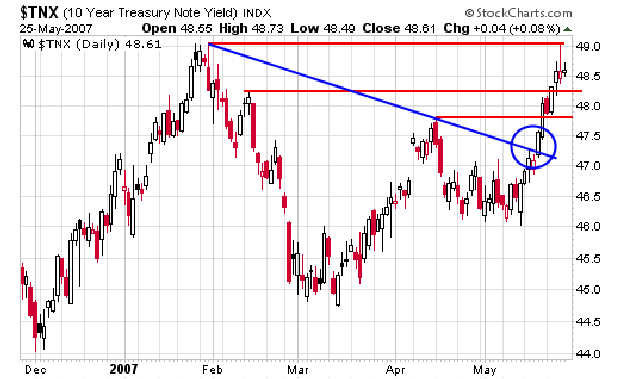
The first chart is the 10 Year T-Note, which shows interest rates are still backing up (rising).
It remains to be seen if this is just a short term event, or the start of a longer term trend up. The latter will cause further problems in the already weak mortgage and housing markets. I lean towards the latter.
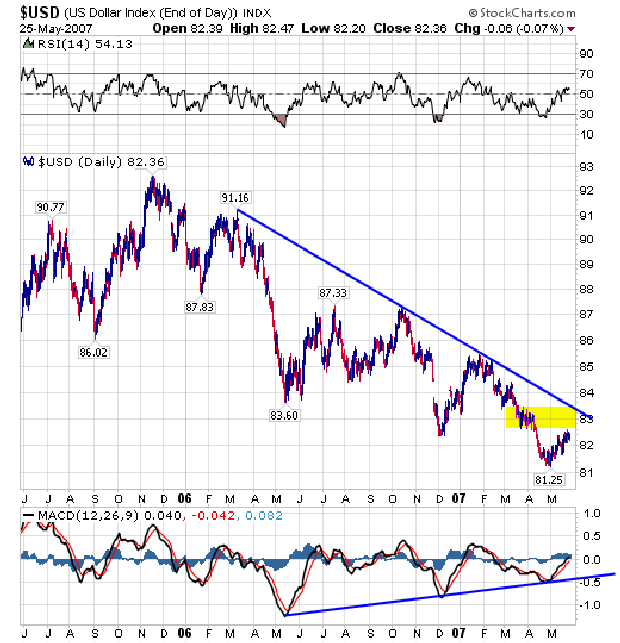
Next is a chart of the U.S. Dollar Index. It shows the severe downtrend that the dollar is in, and it also shows the recent rally up.
The MACD indicator at the bottom of the chart suggests that there may be further upside action.
However, as the chart also shows, overhead resistance is just above in the yellow shaded area.
Gold
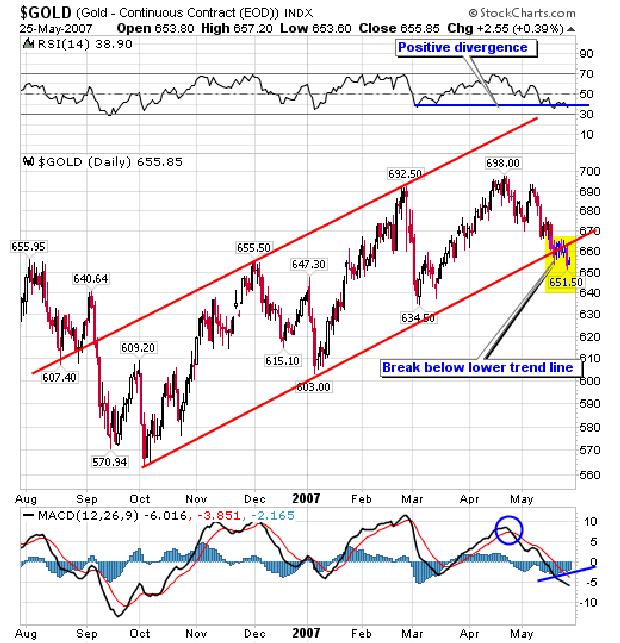
Gold closed the week at $655.85, down $6.15 or -0.93%. It was gold's lowest weekly close in the last 10 weeks.
The lowest daily close of the week was $653.30 on Thursday. The daily closing high for the week was $663.80 on Monday.
The intraday low was $651.50 on Thursday, and the intraday high was $655.90 on Tuesday.
As the first chart below indicates, gold has closed below its lower trend line.
The indicators are mixed: RSI shows positive divergence, MACD shows a negative cross over, and the histograms are beginning to recede.
The weight of the evidence is slightly biased to the downside, unless or until gold rallies back above its lower trend line and up into its channel.
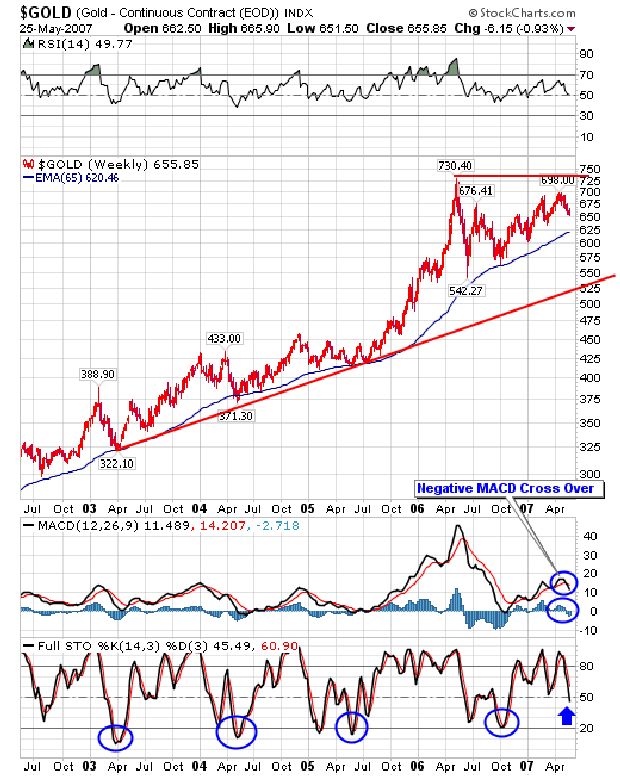
Next up is the weekly chart of gold. MACD shows a negative cross over, and the histograms have just turned negative.
Notice the 65 week moving average, which has held as support all through the bull market.
Presently, the 65 ema is at $620.46, which offers plenty of room to the downside, if that's the way gold decides to go.
STO is at 50, once again a ways above an oversold reading of 20.
Last week we mentioned that gold could go either way, and that it could still easily break down.
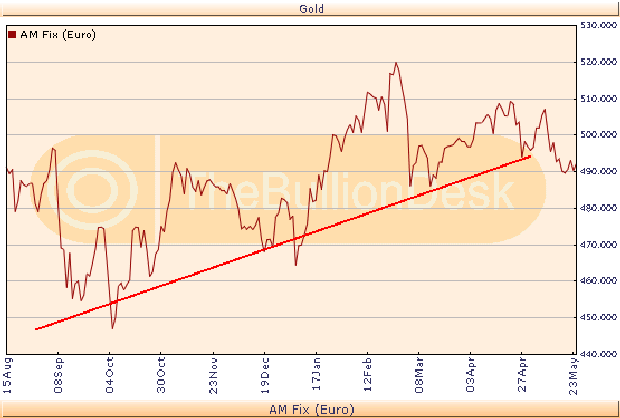
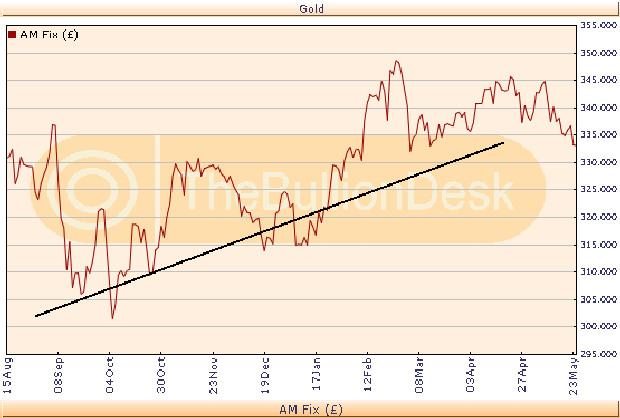
It did break down and the charts show there is further room to the downside before support and oversold levels are reached.
This doesn't mean that it will occur, but that it could. Below are charts of gold priced in the euro and the British pound.

Newmont Mining Indonesia
Silver
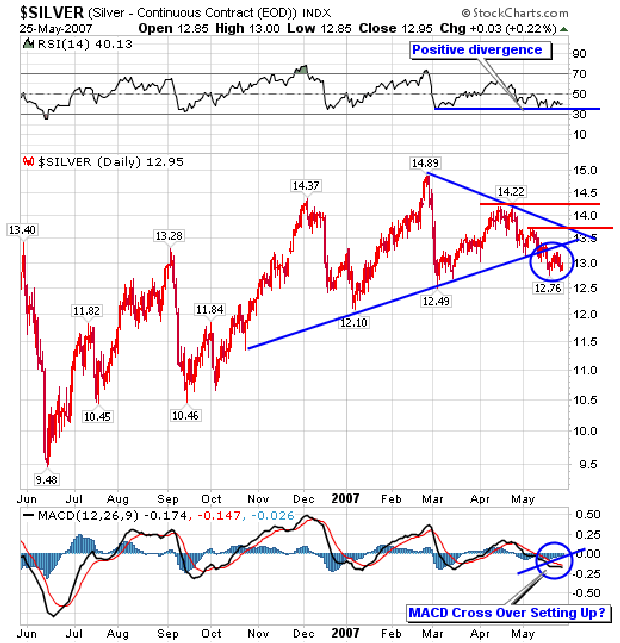
Silver closed at $12.95 down -0.05 cents or -0.42% for the week. It was slivers lowest weekly close in 18 weeks.
The daily closing low for the week was $12.92 on Thursday, and the daily closing high for the week was $13.13 on Monday.
The intraday low was $12.83 on Thursday, and the intraday high was $13.20, occurring on both Tuesday and Wed.
Up first is the daily chart that shows silver clearly breaking below its lower trend line. Also, notice how silver did not better its April high as did gold. This was the first sign of weakness to come.
RSI shows a slight positive divergence from the March low. Histograms are receding, and MACD appears to be setting up for a positive cross over. Thus the signals are mixed.
The weight of the evidence is to the downside until silver can close above its lower trend line.
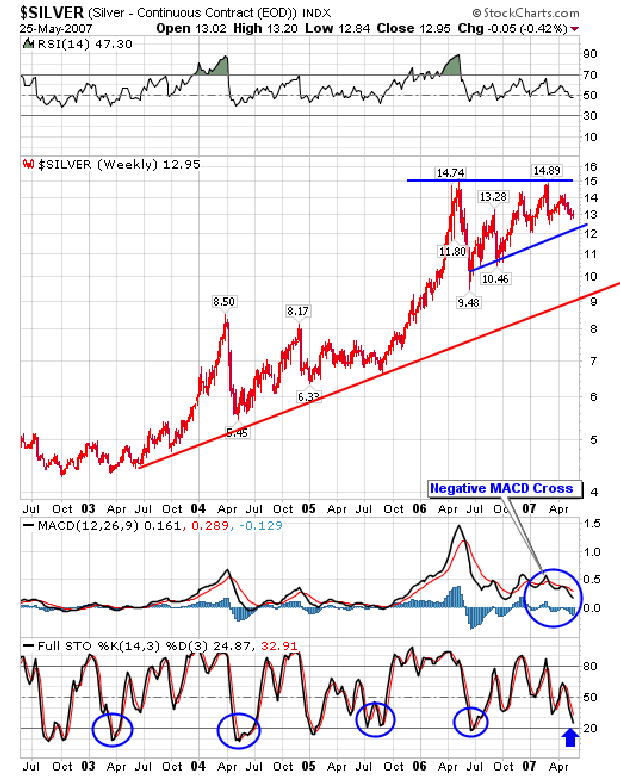
Following the daily chart is the weekly chart of silver. MACD shows a negative cross over, and the histograms are negative. STO is fast approaching oversold (20).
The chart indicates that there is still room to fall lower before support at the lower trend line is reached.
Xau Index
Xau closed down .95 to 135.90, down -0.69%. It was the lowest weekly close in 10 weeks.
The daily closing high was 138.36 on Monday, and the daily closing low was 134.52 on Thursday.
The intraday high was 139.55 on Wednesday, and the intraday low was 134.35 on Thursday.
First up is a daily chart that highlights past lows and what set ups to look for that indicates a new low may be forming.
A positive cross over of the MACD indicator would be a strong indication the low is in and that the trend is changing upwards.
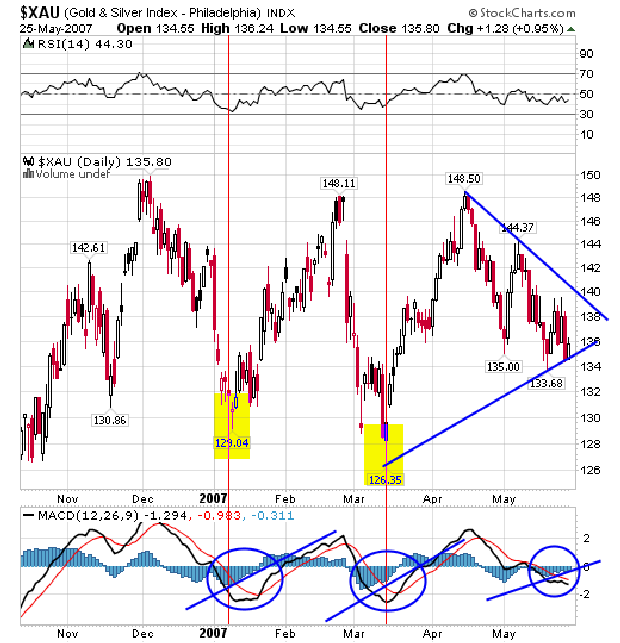
Notice that the Xau tested its lower trend line this week and it held. This suggests that a low may be in.
If the Xau does not break below this level this coming week, and begins moving up, the low will most likely be in place.
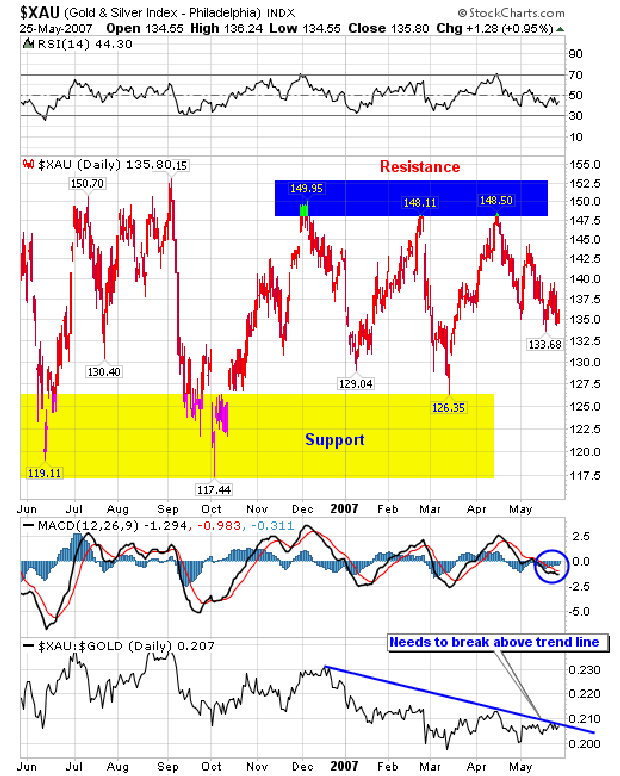
Next is another daily chart of the Xau that shows the overhead resistance outlined in blue and the lower support in yellow.
MACD looks ready to cross over, and histograms are receding. The Xau/Gold Index is trying to break out above its upper trend line.
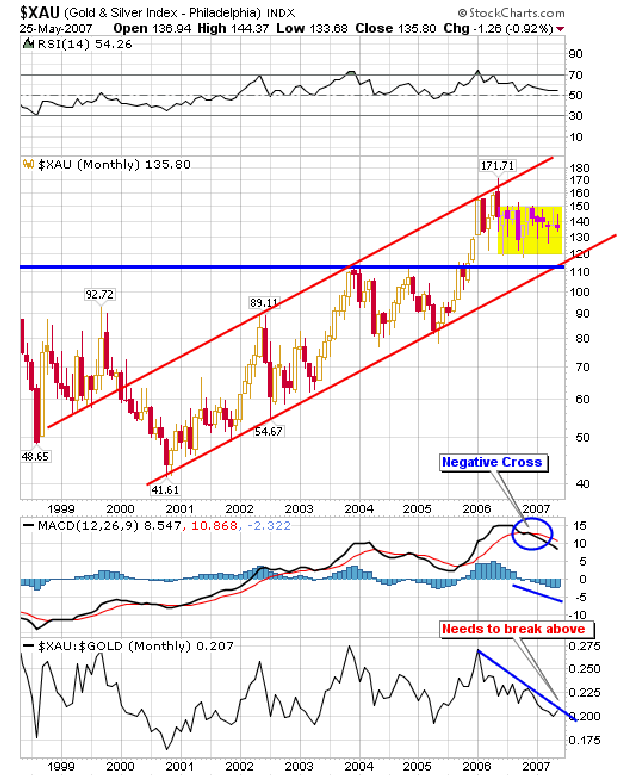
Below is the monthly chart of the Xau Index going back to the start of the gold bull market.
It clearly shows the Xau rising in a relentless move forward, advancing upwards from the lower left hand corner of the chart to the upper right hand corner, a bullish signature.
The index remains well within its rising channel. It has been trading in a trading range between 150 and 130 for almost a year now, occasionally moving down to the 125-120 area.
The blue horizontal line represents the first line of support, while the yellow shaded area is resistance. MACD has made a negative cross over and the histograms are expanding to the downside.
The xau/gold ratio is bumping up against its trend line. A break above this would be positive.
Xau/Gold Ratio
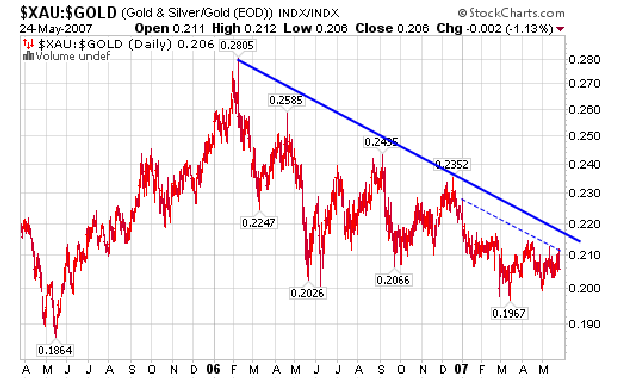
Below is a chart of the Xau/Gold ratio. The ratio appears to have put in a bottom at 0.1967 and is slowly moving higher and is now at 0.206.
A move above the dashed blue line may occur this coming week if the index has a positive week. The solid blue trend line is the marker that a new leg up would be starting.
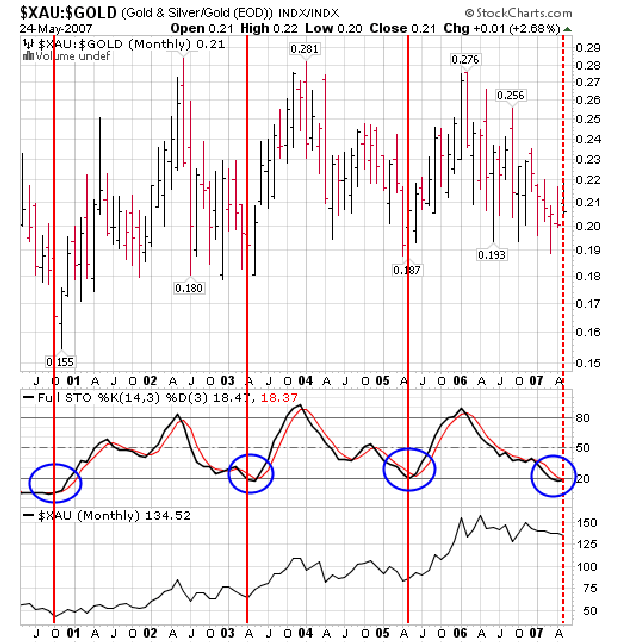
Next is a chart of the Xau/Gold ratio going back to the start of the gold bull market.
Notice the stochastic readings that are circled in blue. In the past they have marked important and significant lows.
If a positive cross occurs it will most likely signal another low is in. This bears close watching as it is very close to occurring.
This coupled with the Xau testing and holding its lower trend line this week are favorable data that a low may be close at hand.
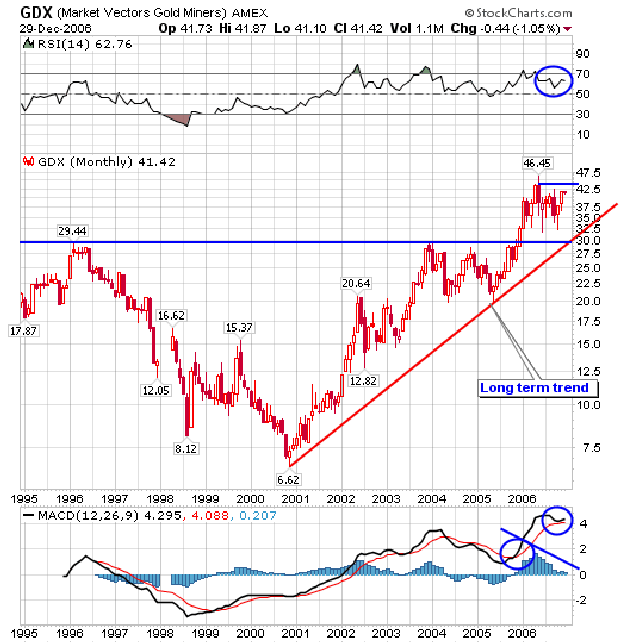
GDX Index
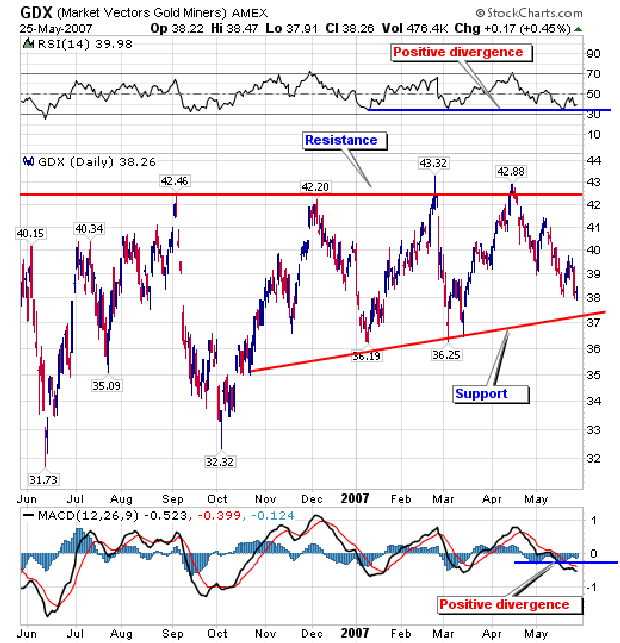
Below is the GDX Market Vectors Gold Miners daily chart. The index closed down .75 to 38.26 (-1.92%) for the week.
RSI is showing positive divergence.
MACD is also showing positive divergence.
The index is well above its March and Jan. lows, keeping the series of higher lows intact.
Histograms are receding back towards zero.
Next is the monthly chart, which clearly defines the long term trend as very positive - moving from the bottom left to the top right of the chart.
The solid blue horizontal line is significant support, and the index is well above that level. Presently, the index is consolidating sideways, with the short blue line indicating overhead resistance.
Both the MACD and histograms bear watching.
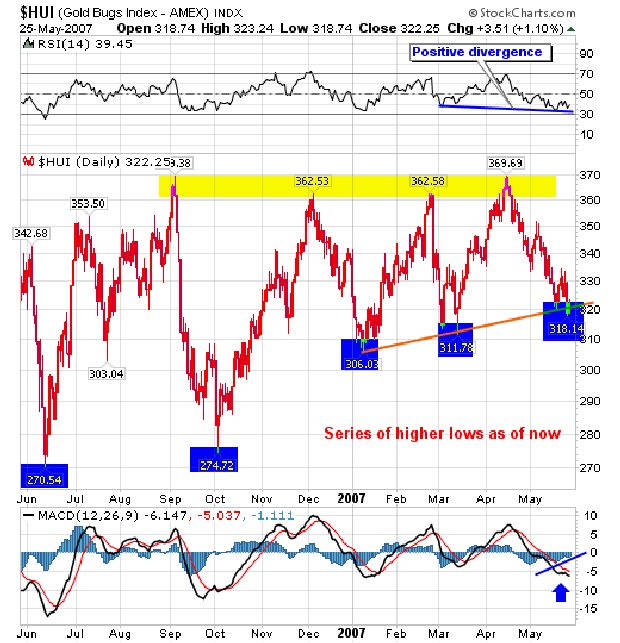
Hui Index
The Hui closed down 6.34 points to 322.25, down -1.93%. It was the lowest weekly close in 18 weeks.
The daily closing low for the week was 318.74 on Thursday, and the daily closing high for the week was 330.77 on Monday.
The intraday low was 318.14 (Thursday), and the intraday high was 334.43 (Monday).
Up first is the daily chart going back to June of 2006. The series of higher lows are clearly evident. Overhead resistance is marked by the yellow shaded area between 360-370.
The index has broken just below its lower trend line. RSI shows a fairly significant positive divergence.
Histograms are receding towards zero and a positive cross of the MACD may be setting up.
Next is the weekly chart that shows the long term trend moving from the bottom left hand corner of the chart to the upper right hand corner - a bullish signature.
A series of higher lows are in place and the index is presently testing its lower trend line.
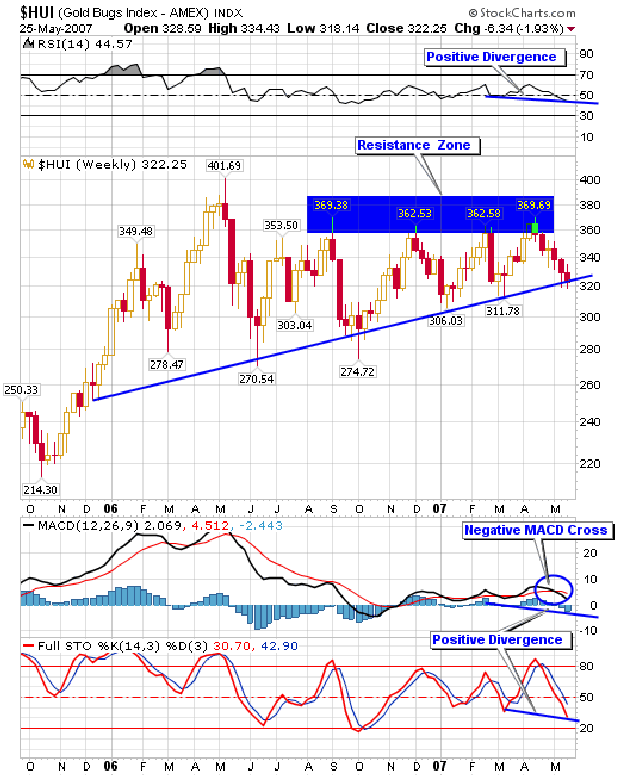
Both the histograms and stochastic indicator show good positive divergence.
The histograms are in negative territory, however, and a negative MACD cross has recently occurred. Once again - the signals are mixed.
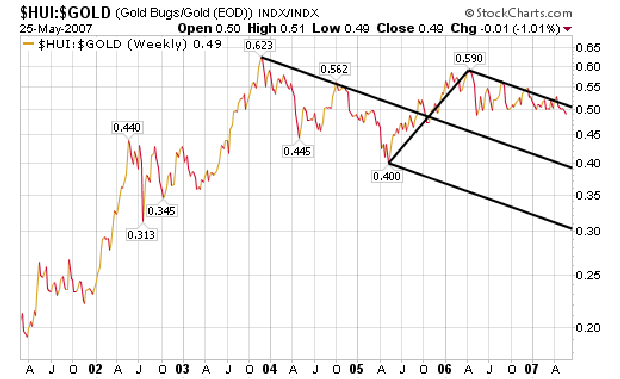
Hui & Xau/Gold Ratios
The first chart below shows the hui/gold ratio. The higher the reading the stronger the gold stocks are compared to physical gold.
The upper fork is resistance that needs to be broken. This will indicate the gold stocks are out performing gold, which then signals a strong precious metals market.
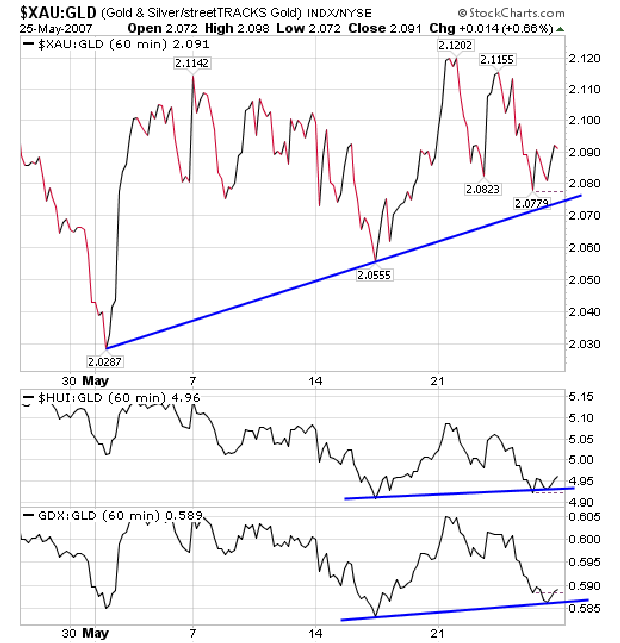
Next are the Hui, Xau, and GDX compared to GLD using a 60 minute chart.
They may be forming a bottom and beginning to move up. This week should be decisive one way or the other, although things could just trend sideways.
PM Stocks Superior Performance
 The year long correction and consolidation has been trying on most investors in the pm sector, but remember - that's what it is supposed to do.
The market never makes it easy to turn a profit. It will use every trick in the book to separate us from our money.
It will try our patience, test our courage, and tempt our greed.
Whatever weaknesses we have the market will bring them out to the fore, and we must do battle with ourselves to overcome our weaknesses, if we are to succeed in the market.
It's not an easy game - it was never meant to be.
Often times we blame the market, or the cartel, or a particular stock that is "no good", when what we should be blaming (or taking responsibility for) is our own investment decisions.
No one puts a gun to our head and says: buy this or that - sell x, y, and z.
We freely choose to buy and sell whatever we decide to invest in. If we decide wrong, if we time the move wrong, we should accept the fact that we were wrong - not the market - not the stock - not the cartel: but us.
I have received several emails saying the precious metal stocks are junk - they're no good anymore. Perhaps this is true - but for it to be true the gold bull will have to have turned to a gold bear.
So far that is not the case. It is what it is until it isn't, and right now it's a bull market. The pm sector is undergoing a long and trying correction, but it has not yet broken down out of its long term bullish trend.
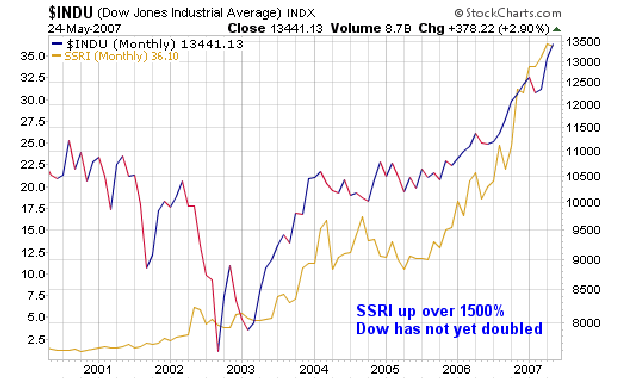
The overall stock market is performing admirably. Below are some comparisons of certain precious metal stocks with the performance of the Dow.
Indu/SSRI
Indu/AEM
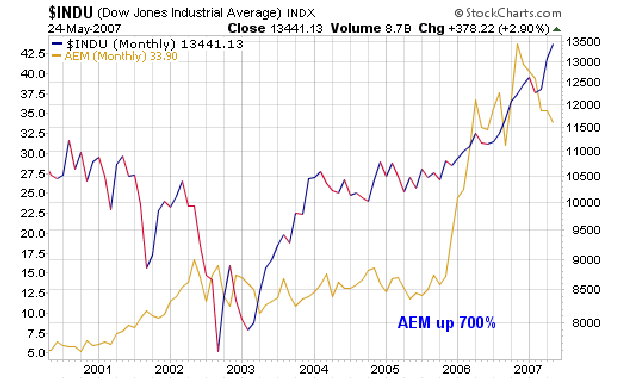
Regardless of how well the Dow has done the past few years, since 2001 the gold and silver stocks have kicked butt, and the best is yet to come.
Summary
Interest rates are backing up. We still maintain that any surprises will be to the upside. This will not be good for the mortgage and real estate markets. We expect problems with the stock market by fall.
 The US Dollar is burnt toast. Presently it is undergoing a counter trend rally up.
More upside may yet come, however, overhead resistance is fast approaching and we do not expect it to be overcome.
Both gold and silver have broken support below their lower trend lines.
Such action suggests more may be coming. Silver has been weaker then gold, and will most likely continue so, at least until the next phase up begins.
All three precious metal indexes were down significantly for the week: the Xau, the Hui, and the GDX.
Of the three indexes the GDX is the most positive. Its daily chart had a few positive divergences that look good. It is also still well above its lower trend line.
The Xau is sitting on top if its lower trend line, and the Hui has broken just below its lower support line.
The signals/indicators are mixed within all three indexes. The monthly xua/gold ratio looks the best of all the charts.
It hints that a low is close at hand or has already occurred. The March and January lows may yet be tested, however.
We are still accumulating on weakness, and added a few more positions during the past week. See the gold portfolio for updates.
Good luck. Good trading. Good health. And that's a wrap.
Invitation
Stop by our website and check out the complete market wrap, which covers most major markets. There is also a lot of information on gold and silver, not only from an investment point of view, but also from its position as being the mandated monetary system of our Constitution - Silver and Gold Coins as in Honest Weights and Measures.
There is also a live bulletin board where you can discuss the markets with people from around the world and many other resources too numerous to list. Drop by and check it out. Good luck. Good trading. Good health. And that's a wrap.
Come visit our new website: Honest Money Gold & Silver Report
Douglas V. Gnazzo
Honest Money Gold & Silver Report
Douglas V. Gnazzo is the retired CEO of New England Renovation LLC, a historical restoration contractor that specialized in the restoration of older buildings and vintage historic landmarks. Mr. Gnazzo writes for numerous websites, and his work appears both here and abroad. Just recently, he was honored by being chosen as a Foundation Scholar for the Foundation of Monetary Education (FAME).
Disclaimer: The contents of this article represent the opinions of Douglas V. Gnazzo. Nothing contained herein is intended as investment advice or recommendations for specific investment decisions, and you should not rely on it as such. Douglas V. Gnazzo is not a registered investment advisor. Information and analysis above are derived from sources and using methods believed to be reliable, but Douglas. V. Gnazzo cannot accept responsibility for any trading losses you may incur as a result of your reliance on this analysis and will not be held liable for the consequence of reliance upon any opinion or statement contained herein or any omission. Individuals should consult with their broker and personal financial advisors before engaging in any trading activities. Do your own due diligence regarding personal investment decisions. This article may contain information that is confidential and/or protected by law. The purpose of this article is intended to be used as an educational discussion of the issues involved. Douglas V. Gnazzo is not a lawyer or a legal scholar. Information and analysis derived from the quoted sources are believed to be reliable and are offered in good faith. Only a highly trained and certified and registered legal professional should be regarded as an authority on the issues involved; and all those seeking such an authoritative opinion should do their own due diligence and seek out the advice of a legal professional. Lastly, Douglas V. Gnazzo believes that The United States of America is the greatest country on Earth, but that it can yet become greater. This article is written to help facilitate that greater becoming. God Bless America.
© 2005-2022 http://www.MarketOracle.co.uk - The Market Oracle is a FREE Daily Financial Markets Analysis & Forecasting online publication.