Gold and Silver Correction Over, or is This Just a Beginning?
Commodities / Gold & Silver 2009 Jun 08, 2009 - 01:18 PM GMT This week we have seen precious metals and mining stocks peak, just as I’ve indicated in the previous Premium Update. In the summary of last week’s update I wrote that “Although prices of gold, silver and mining stocks are reaching their own resistance levels, such a correction will most likely be caused by some kind of catalyst, probably a strong move in the U.S. Dollar, or in the general stock market”. It turned out that the catalyst was in fact the U.S. Dollar, however I will get back to this issue later in this update.
I will start explaining my opinion on the current situation on the precious metals market, by covering one of our indicators (from the Charts section). It has been particularly useful in determining bottoms during the big comeback of the precious metals sector (approximately since October 2008). The SP Short Term Gold Stock Bottom Indicator has signaled virtually every important local bottom in the previous 8 months, and thus it is definitely worth including in this update. Please take a look at the chart below for details.
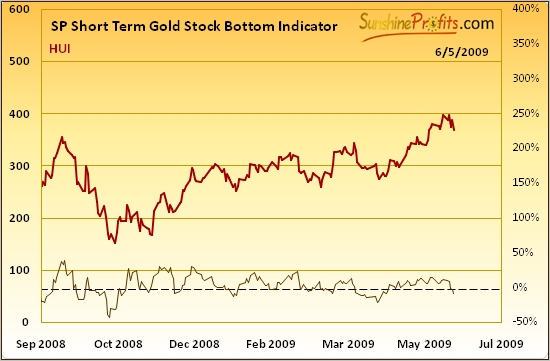
For those of you, who are not yet familiar with our Charts section - the buy signal is given, when indicator is below the dashed line and starts to rise (when value of the indicator has been falling for 3 consecutive days and then the next day is higher). It is based on data from more than one market (it’s much more complex than ratios), so it really is available on our website on an exclusive basis.
It was at the end of March 2009 when this indicator flashed the last “buy” signal. The reason that I mention this indicator today is not because of what it has just signaled, but because of the fact that it did NOT signal anything so far, and this situation is likely to change in the near future. Naturally, just as this indicator’s name suggests, I have designed it to help us determine particularly favorable moments to add to our long- and/or close/limit short positions in PM stocks. Since this indicator’s performance has been so impressive in the recent months, it makes sense to take a closer look at the way it works.
As I mentioned above, the first condition that needs to be met in order for this indicator to signal a speculative buying opportunity is that it needs to be below the dashed line. This line corresponds to the 0% level in the right vertical axis. Once the indicator goes below the dashed line, it will flash “buy” as soon as it turns up. Right now we have just seen this indicator break below the 0% level, so the “buy signal” is rather near. Of course, it may continue to fall for an additional week or two, but the history shows that it turns up rather quickly after going below the dashed line.
The implication of the above analysis for anyone interested in PM stocks is that we may soon have a favorable buying opportunity, as this indicator turns up. Naturally, many factors need to be considered (definitely more than one indicator), but given the extraordinary performance of this particular technique, one should not ignore it.
Similar thing can be said about physical metals, as they usually move together with the mining stocks (usually lagging behind them, but there are many exceptions from this general rule). In other words – gold and silver are positively correlated with mining stocks.
USD Index
Last week I mentioned that USD Index is in the oversold territory and bound for a quick bounce. This week that pullback materialized.
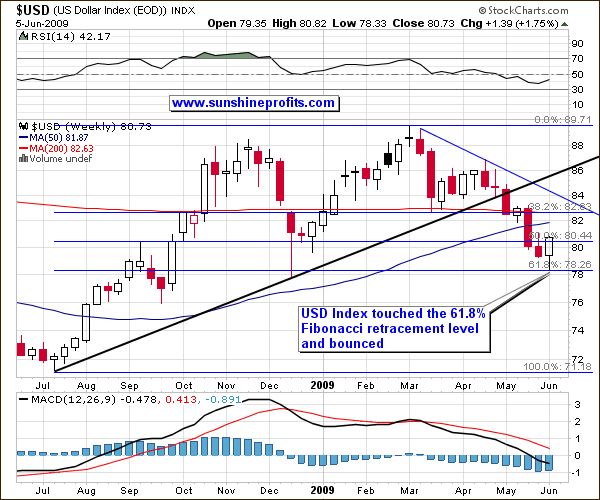
USD Index briefly touched the 61.8% Fibonacci retracement level and bounced. The question here is whether this was the ultimate bottom (unlikely in my view), a correction that is already completed (more likely), or the beginning of a several-week correction (even more likely).
For more detailed signals we need to consider a short term chart.
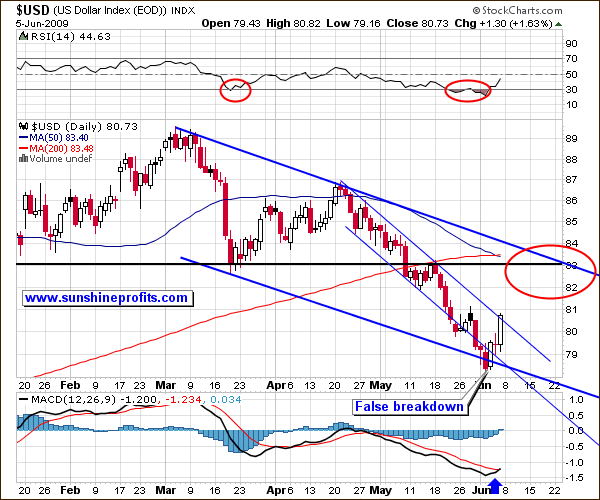
The short-term chart gives us additional resistance levels that might stop this rally, but none of them provides one decisive resistance level. Rallies that begin with a fake breakout or fake breakout tend to be stronger than those, who begin in a different way, so I expect this rally to continue in the following days. It’s too early to say where exactly this rally will end, but nonetheless I’ve marked the most probable topping area with a red ellipse. This corresponds to approximately 82-83 level.
In sum, the USD Index appears to have put a local bottom. It is too early to say where and when this rally may end, but short-term factors suggest that it will go above the 82 level. Analysis of USD Index from a long-term perspective provides us with additional details, but that part of my commentary is reserved for Premium Service Members.
Gold
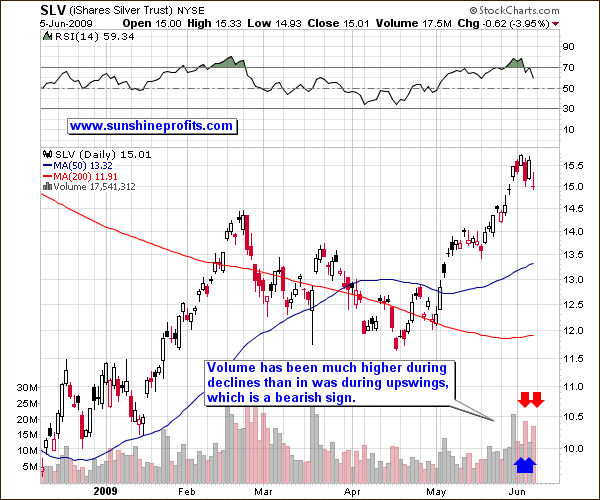
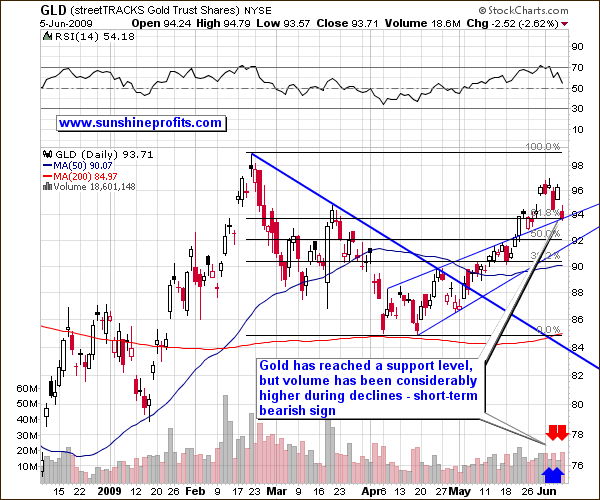
This week gold has moved lower along with rise in the value of USD Index. As I mentioned above, U.S. Dollar is likely to move higher in the following days/weeks, we may see gold move even lower on a short-term basis. This is confirmed by the high, negative correlation between USD and gold, and the way volume shaped during the previous week.
If you looked at the volume from a broad perspective, you would not see anything extraordinary – the average value of volume has been neither exceptionally high, nor low. However, once you consider details, the outlook becomes rather bearish in the short term. The point here is that volume has been declining while gold has been rising and it rose along with declining gold price. Volume usually confirms the direction in which the market is headed, and this time it points to lower prices in coming days. Naturally, a day or two of pause are possible (and also quite likely), as gold is currently just at its support level, but still - it is likely that gold will move lower in the short term.
Silver
Similar analysis can be applied also to the silver market
As mentioned above, from the short term point of view, the situation on the silver market is currently similar to the one on the gold market. Moreover, the volume gives much clearer signals, as the difference between days when price of silver rose and days when it fell, is even more evident. Therefore, the silver market may also experience a correction from here.
Summary
The USD Index has just bounced after having declined for a month, which lead to lower values throughout the whole PM sector. Taking into account dollar’s previous correction and the technical situation in gold, silver, and mining stocks, we may expect this correction to continue for the next few days/weeks. Once this “breather” is complete, we will probably have a favorable buying opportunity, which will most likely be confirmed by indicators from our Charts section.
Naturally, long-term situation still remains bullish for the whole PM sector, as the fundamentals are favorable.
To make sure that you get immediate access to my thoughts on the market, including information not available publicly, I urge you to sign up for my free e mail list. Sign up today and you’ll also get free, 7-day access to the Premium Sections on my website, including valuable tools and charts dedicated to serious PM investors and speculators. It’s free and you may unsubscribe at any time.
P. Radomski
Editor
Interested in increasing your profits in the PM sector? Want to know which stocks to buy? Would you like to improve your risk/reward ratio?
Sunshine Profits provides professional support for precious metals Investors and Traders.
Apart from weekly Premium Updates and quick Market Alerts, members of the Sunshine Profits’ Premium Service gain access to Charts, Tools and Key Principles sections. Click the following link to find out how many benefits this means to you. Naturally, you may browse the sample version and easily sing-up for a free trial to see if the Premium Service meets your expectations.
All essays, research and information found above represent analyses and opinions of Mr. Radomski and Sunshine Profits' associates only. As such, it may prove wrong and be a subject to change without notice. Opinions and analyses were based on data available to authors of respective essays at the time of writing. Although the information provided above is based on careful research and sources that are believed to be accurate, Mr. Radomski and his associates do not guarantee the accuracy or thoroughness of the data or information reported. The opinions published above belong to Mr. Radomski or respective associates and are neither an offer nor a recommendation to purchase or sell securities. Mr. Radomski is not a Registered Securities Advisor. Mr. Radomski does not recommend services, products, business or investment in any company mentioned in any of his essays or reports. Materials published above have been prepared for your private use and their sole purpose is to educate readers about various investments.
By reading Mr. Radomski's essays or reports you fully agree that he will not be held responsible or liable for any decisions you make regarding any information provided in these essays or reports. Investing, trading and speculation in any financial markets may involve high risk of loss. We strongly advise that you consult a certified investment advisor and we encourage you to do your own research before making any investment decision. Mr. Radomski, Sunshine Profits' employees and affiliates as well as members of their families may have a short or long position in any securities, including those mentioned in any of the reports or essays, and may make additional purchases and/or sales of those securities without notice.
Przemyslaw RadomskiArchive |
© 2005-2022 http://www.MarketOracle.co.uk - The Market Oracle is a FREE Daily Financial Markets Analysis & Forecasting online publication.


