Economic Deflation hard Evidence from Flow of Funds Report
Economics / Deflation Jun 19, 2009 - 11:55 AM GMTBy: Mike_Shedlock
 I am not sure if this was his intent, but recent analysis of the Flow of Funds Report by Martin Weiss eloquently makes the case for deflation.
In New, Hard Evidence of Continuing Debt Collapse! Martin Weiss Writes ...
While most pundits are still grasping at anecdotal “green shoots” to celebrate the beginning of a “recovery,” the hard data just released by the Federal Reserve reveals a continuing collapse of unprecedented dimensions.
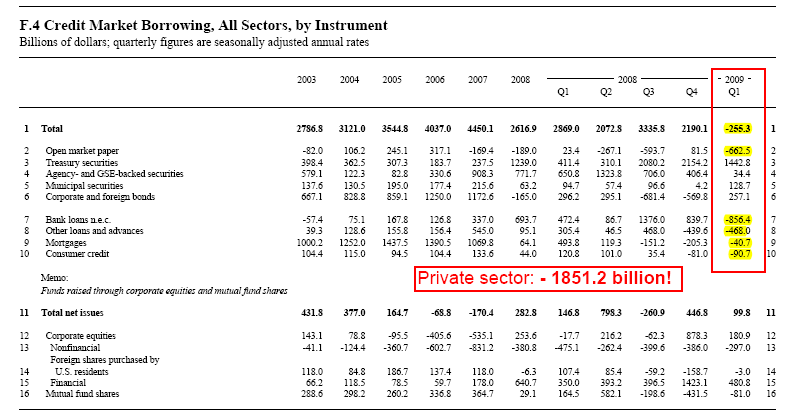
It’s all in the Fed’s Flow of Funds Report for the first quarter of 2009, which I’ve posted on our website with the key numbers in a red box for all those who would like to see the evidence.
First and foremost, the Fed’s numbers demonstrate, beyond a shadow of a doubt, that the credit market meltdown, which struck with full force after the Lehman Brothers failure last September, actually got a lot worse in the first quarter of this year.

Open Market Paper: Instead of growing as it had in almost every prior quarter in history, it collapsed at the annual rate of $662.5 billion. (See line 2.)
Banks lending: Credit markets [collapsed] at the astonishing pace of $856.4 billion per year, their biggest cutback of all time (line 7).
Nonbank lending: (line 8) pulled out at the annual rate of $468 billion, also the worst on record.
Mortgage lenders: (line 9) pulled out for a third straight month. (Their worst on record was in the prior quarter.)
Consumers: (line 10) were shoved out of the market for credit at the annual pace of $90.7 billion, the worst on record.
The ONLY major player still borrowing money in big amounts was the United States Treasury Department (line 3), sopping up $1,442.8 billion of the credit available — and leaving LESS than nothing for the private sector as a whole.
Bottom line: The first quarter brought the greatest credit collapse of all time.
Excluding public sector borrowing (by the Treasury, government agencies, states, and municipalities), private sector credit was reduced at a mindboggling pace of $1,851.2 billion per year!
And even if you include all the government borrowing, the overall debt pyramid in America shrunk at an annual rate of $255.3 billion (line 1)!
Did they make any headway in stopping the ABS collapse? None whatsoever! The total outstanding in this sector (page 34 line 3) fell at an annual pace of $623.4 billion in the first quarter, the WORST ON RECORD!
U.S. security brokers and dealers were smashed (page 36 line 3). Brokers were forced to reduce their total investments at the breakneck annual pace of $1,159.2 billion in the first quarter, after an even hastier retreat in the prior quarter!
Government agencies got killed (page 43 line 6). Households dumped their Ginnie Maes, Fannie Maes, Freddie Macs, and other government-agency or GSE securities like never before in history, unloading them at the go-to-hell annual clip of $1,395.7 billion.
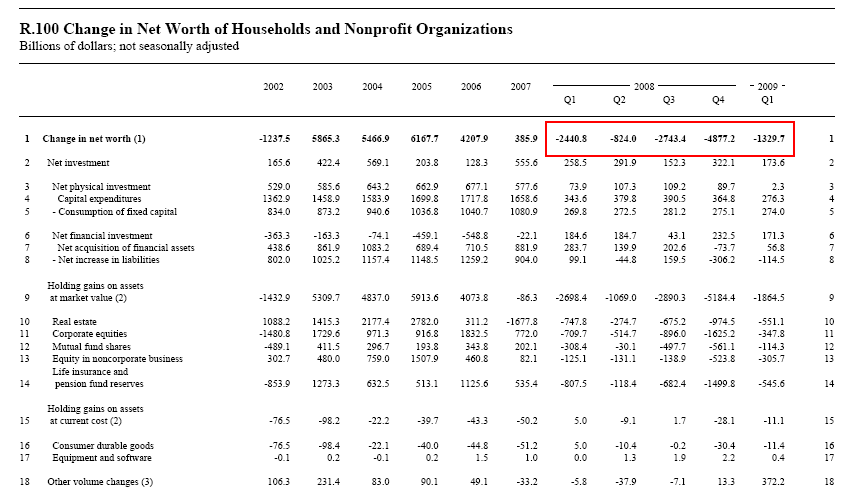
Change In Household Net Worth

"In U.S. households alone, the losses have been massive: massive: $1.39 trillion in the third and fourth quarters of 2007 (not shown on page 105) … a gigantic $10.89 trillion in 2008 … $1.33 trillion in the first quarter of 2009 … $13.87 trillion in all, by far the worst of all time."
There are many other lines Martin highlighted. Click on the report (the first link above) and see for yourself just how bad things are.
Martin states "Bottom line: The first quarter brought the greatest credit collapse of all time." But not only did he state it, he proved it.
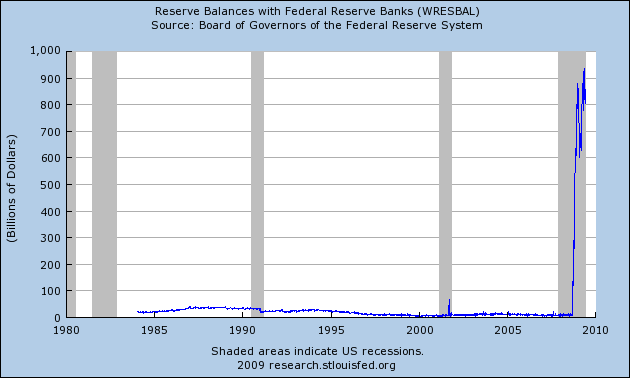
Moreover, I can prove banks aren't lending.
Reserve Balances with Federal Reserve Banks

To say this situation is unprecedented does not do justice to the word.
Hyperinflation, or even strong inflation predictions in the near term look rather silly in the face of this data unless one is only looking at the printing and not the destruction in credit.
OK treasury yields have been soaring, but that is belief in green shoots, a rebound from ridiculous levels, and massive supply of treasuries. And in case you did not notice, government bond yields have been soaring the world over, not just in the US.
Bear in mind my definition of deflation includes marked to market values of bank credit. It's very difficult to get a handle on Marked to Market anything as the Fed is still fighting rules that would mandate it. However, we do know there is still a mountain of things hidden off balance sheets in SIVs (Citigroup alone has $800 billion and what that is really worth is anyone's guess). Furthermore massive credit card losses are on the way as unemployment rises, and of course we cannot forget the upcoming crisis in Alt-A and Pay Option ARM mortgages.
Think consumers are about to go on a spending spree after a massive $13.87 trillion collapse in net worth? Think banks are going to start lending with this employment picture and household debt? I don't and boomer demographics makes the situation even worse. Don't forget the bleak employment picture. There is no source of jobs.
Those who get hyperinflation out of this picture must be reading the playbook in Bizarro World because it sure is not the playbook here
By Mike "Mish" Shedlock
http://globaleconomicanalysis.blogspot.com
Click Here To Scroll Thru My Recent Post List
Mike Shedlock / Mish is a registered investment advisor representative for SitkaPacific Capital Management . Sitka Pacific is an asset management firm whose goal is strong performance and low volatility, regardless of market direction.
Visit Sitka Pacific's Account Management Page to learn more about wealth management and capital preservation strategies of Sitka Pacific.
I do weekly podcasts every Thursday on HoweStreet and a brief 7 minute segment on Saturday on CKNW AM 980 in Vancouver.
When not writing about stocks or the economy I spends a great deal of time on photography and in the garden. I have over 80 magazine and book cover credits. Some of my Wisconsin and gardening images can be seen at MichaelShedlock.com .
© 2009 Mike Shedlock, All Rights Reserved
Mike Shedlock Archive |
© 2005-2022 http://www.MarketOracle.co.uk - The Market Oracle is a FREE Daily Financial Markets Analysis & Forecasting online publication.


