


What’s Wrong with the British Pound?
Currencies / British Pound Jun 25, 2009 - 04:28 PM GMTBy: Seven_Days_Ahead

 The Macro Trader’s view:
After a solid rally away from the lows stretching over 3 months, much of June has been characterized by sideways trading. Cable seems to have has lost its way.
What has brought about the current spell of directionless trading? Will it resolve itself into a continuation of Sterling’s rally against the Dollar or will there be a retest of the lows?
The rally which begun back in March was, in our judgement, driven by the realisation that earlier forecasts which predicted the UK economy would be the worst affected of the G7 economies in the current down turn, had been proved wrong.
Moreover, data began to show the UK hitting a bottom in the recession ahead of the other leading economies and moved on to predict recovery in the 3rd or 4th quarter of this year - notable reports were the PMI Services survey and NIESR GDP estimate, and housing data was also supportive.
What then, has changed? Has the data begun to point to a double dip or has the US economy suddenly begun to accelerate out of recession, with a familiar V shaped recovery? The answer to all of these questions is no. The UK is still releasing data consistent with recovery expectations and the US economy continues to show gradual (if unspectacular) improvement with growth expected to resume late 4th quarter 2009 or 1st quarter 2010. The only material change among the major economies is the Euro zone, which looks to be further away from recovery than recently thought.
So why is Cable looking confused? The Bank of England Governor has sought to play down recent bullish data, saying the recovery still looks uncertain and a long hard slog back to growth is expected. This is the same group of policy- makers that failed to recognise the severity of the looming recession until it was upon them, and the same group that have consistently forecast a collapse in inflation that has yet to materialise. Conclusion? Take their utterances with a pinch of salt. The Bank is being cautious because it does not want to risk building pressure for a tighter policy, forcing it to act prematurely and risk killing the recovery.
The Bank is clearly taking the line that it would be better to even allow a “little” inflation to take hold (which they see a correction) as an easier and more familiar fight.
What then of the US? The Fed did moderate its language in yesterday’s FOMC policy statement thereby easing concern over deflation. But it reiterated that rates would remain at the current low levels for an extended period. Not much new there. But they also repeated their view that the economy was set to recover over the time-frame previously stated.
In short, the current environment sees both the Fed and the Bank of England taking a cautious approach to recovery signs in their respective economies, leading to a state of inertia among traders who had already begun to doubt whether the evidence they had seen of growth was real or no more than a pause in the recessionary environment.
We judge the UK is set to recover this year and the longer the Bank delays in changing policy, (although to act now would be premature) the stronger that recovery will be, which we expect to act as strong support for Sterling over the coming months.
The Technical Trader’s view:
The market reversed at the old Pivot from 2001 by completing a Double Bottom. But the minimum move of that Bottom has been achieved. 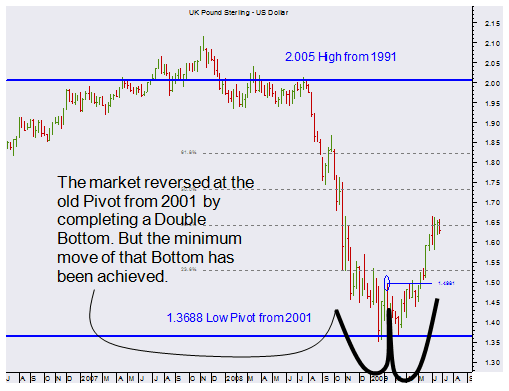
|
WEEKLY CHART The market is still stagnating around that 38.2% Fibonacci retracement.
We’re frustrated. We think there are good fundamental reasons for it to go further.
But it just ain’t doing it yet.
Look closer. |
|
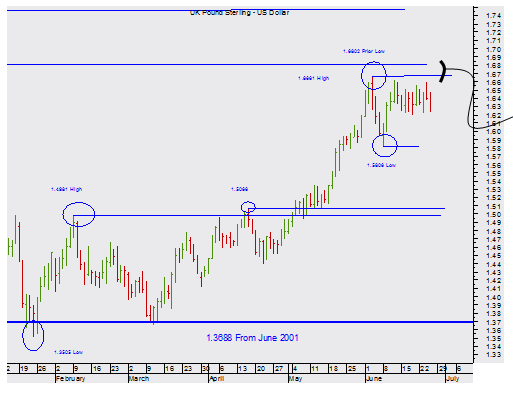
DAILY CHART The tedious sideways price action is at least testament to the resilience of the market.
For there seems little appetite to sell off.
But a break up through the 1.6661/1.6802 band would certainly be reassuring and lead to further buying.
|
By Mark Sturdy
John Lewis
Seven Days Ahead
Be sure to sign up for and receive these articles automatically at Market Updates
Mark Sturdy, John Lewis & Philip Allwright, write exclusively for Seven Days Ahead a regulated financial advisor selling professional-level technical and macro analysis and high-performing trade recommendations with detailed risk control for banks, hedge funds, and expert private investors around the world. Check out our subscriptions.
© 2009 Copyright Seven Days Ahead - All Rights Reserved
Disclaimer: The above is a matter of opinion provided for general information purposes only and is not intended as investment advice. Information and analysis above are derived from sources and utilising methods believed to be reliable, but we cannot accept responsibility for any losses you may incur as a result of this analysis. Individuals should consult with their personal financial advisors.
Seven Days Ahead Archive |
© 2005-2022 http://www.MarketOracle.co.uk - The Market Oracle is a FREE Daily Financial Markets Analysis & Forecasting online publication.