What Happened on the Banking Index Yesterday?
Stock-Markets / Banking Stocks Jun 30, 2009 - 08:58 AM GMTBy: Marty_Chenard
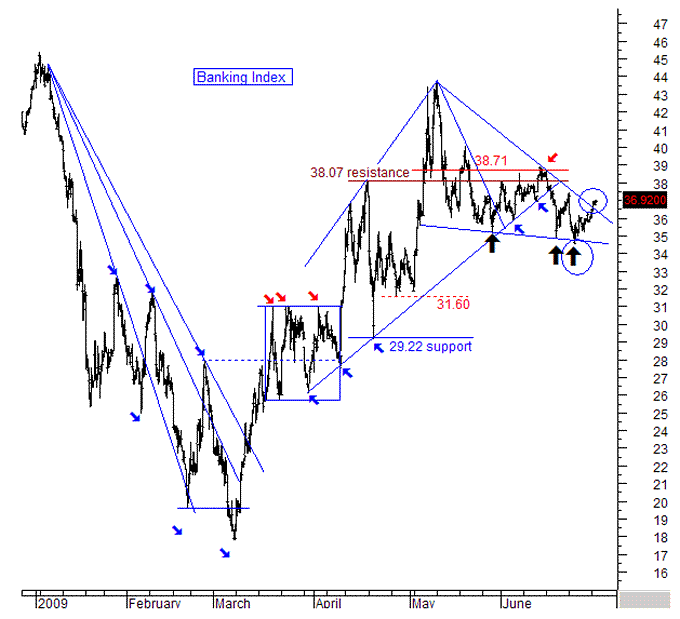
 Given the action on the Banking Index in the past week, it is only fair that I post an update on this index today.
The Banking Index has been one of those fascinating charts that has been amazing relative to support and resistance levels.
Last Tuesday, we pointed out that: "The Banking Index was testing its triangle's May/June support level. A breach of this support could have serious downside implications for the Banking Index".
What happened? The Banking Index broke below the support and that breach only lasted minutes and then moved back up. Does that count as a support break? It counts as an infraction against the Bulls, kind of like a "dent" on the side of your car lessening some of its value.
Yesterday, the Banking Index did the opposite ... it moved up to the triangle's resistance line and then closed above it.
Did that count as a strong upside breakout? No ... it had more behind it than the downside breach, but it was not a condition with any impressive strength. With that said, it could still make its way up to the 37.90 level ... and what happen's after that would be important.
What did I previously tell our Advanced Subscribers? I said: "I would be a little suspicious if we break to the upside because we had a brief downside breach of the support last week. That just says that there is a serious battle between the bulls and bears that needs to be resolved. Let's give this some breathing room to see if yesterday will hold."
This is a complicated battle and it is not over ... keep an eye on it, its symbol is $BKX.

________________________________________________
*** Feel free to share this page with others by using the "Send this Page to a Friend" link below.
By Marty Chenard
http://www.stocktiming.com/
Please Note: We do not issue Buy or Sell timing recommendations on these Free daily update pages . I hope you understand, that in fairness, our Buy/Sell recommendations and advanced market Models are only available to our paid subscribers on a password required basis. Membership information
Marty Chenard is the Author and Teacher of two Seminar Courses on "Advanced Technical Analysis Investing", Mr. Chenard has been investing for over 30 years. In 2001 when the NASDAQ dropped 24.5%, his personal investment performance for the year was a gain of 57.428%. He is an Advanced Stock Market Technical Analyst that has developed his own proprietary analytical tools. As a result, he was out of the market two weeks before the 1987 Crash in the most recent Bear Market he faxed his Members in March 2000 telling them all to SELL. He is an advanced technical analyst and not an investment advisor, nor a securities broker.
Marty Chenard Archive |
© 2005-2022 http://www.MarketOracle.co.uk - The Market Oracle is a FREE Daily Financial Markets Analysis & Forecasting online publication.


