


Stock Market Potential Trend Changer
Stock-Markets / Stock Index Trading Jul 04, 2009 - 08:16 PM GMTBy: Jack_Steiman

 There has been one constant since the March lows. Once we blasted up off the bottom, the S&P 500 took but a few weeks to clear the 50-day exponential moving average. Once over, it had never relinquished that key moving average until Thursday. Basically above for four months. When you lose a substantial moving average after that length of time, you need to take notice of this event and what the message is that it could quite conceivably be sending.
It's definitely not a bullish one. What it could be telling us is that we're transitioning from a bullish trend in to a bearish one. We only closed four points below the 50-day exponential moving average on the SPX and this is not a deep enough close below this key level to say the party is over for sure. Add in the fact that the 60-minute time frame charts are extremely oversold and we could move right back over on Monday. That said, the action was bearish across the board today as everyone participated in the selling.
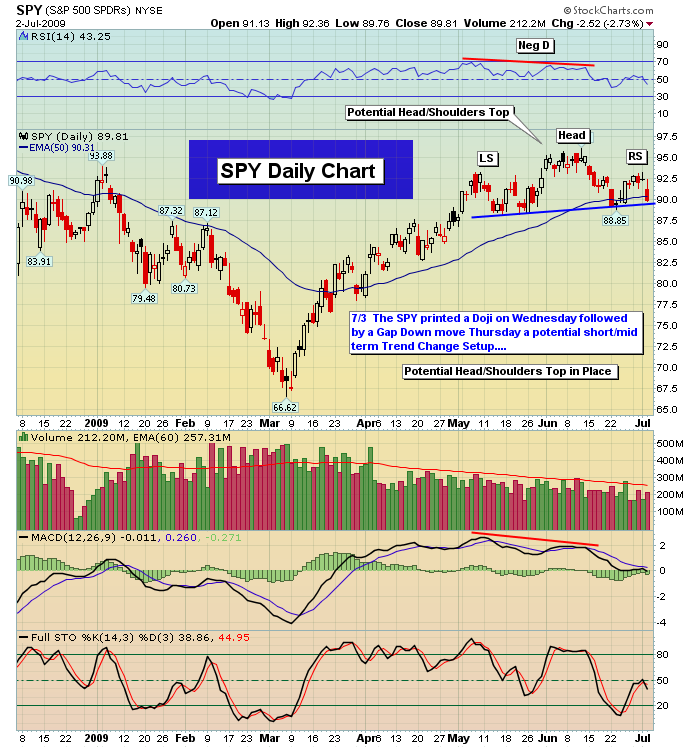
Also, just because we may go back over 901 on Monday, and that's a big if, it doesn't mean that'll hold. We may just relieve the overbought short term time frame charts and head right back down. If you look at the daily charts on all the major index charts you can clearly see that they are not even remotely close to being oversold and thus they should ultimately allow the bears to do their dirty deed if we are in fact making that bull to bear transition. There is further downside possible before the daily's become too compressed on the sell side. After seeing continued headwinds at our 200 EMA topside the market has finally given way to a test and 50 EMA breakdown move. Bottom line is the loss of 901 on the Sp 500 opens the door to a key test of the final line in the sand for the bulls or the long term support at 875. If the bulls lose 875 the door is open to deeper selling as there's very little in terms of important support below that. They'd have little to no fear. This would bode poorly for the market and there's no telling how bad things could get. The bears know they'd be in full control of things and they will thus become very aggressive. Losing 875 SPX would be devastating news for the bulls so please keep that in mind.
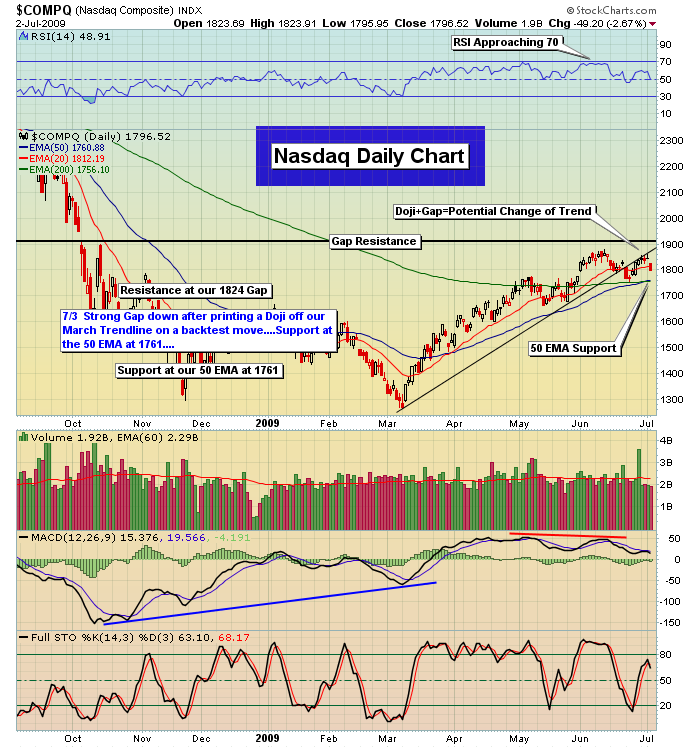
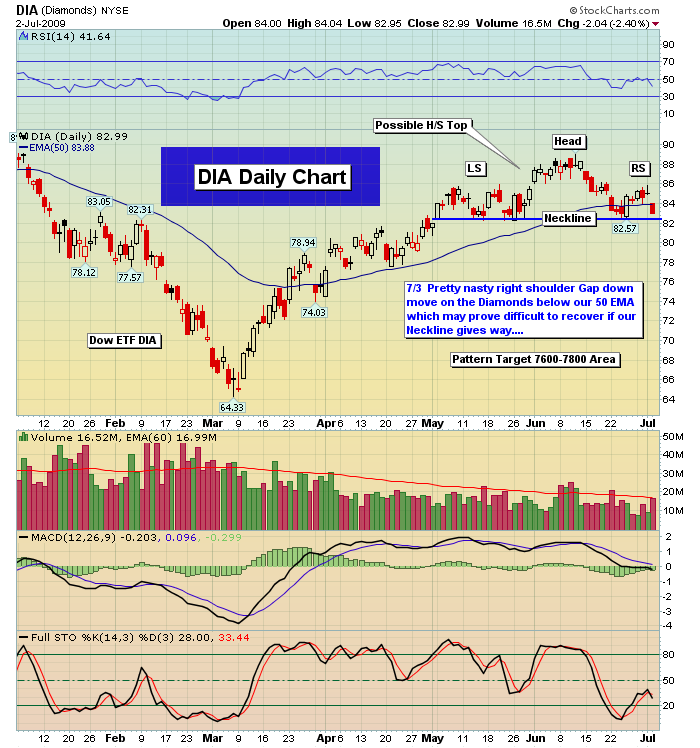
During Wednesday's session we noted that most major Indices including the Nasdaq, DIA, SPY, etc., had printed Doji Candles which indicate that the sellers may have caught up to the buyers after a long move up off the March lows. Yet you need confirmation of that Doji in the session to follow which is what we saw with our Thursday morning Gap down move. This 2-stick pattern can often be a trend changer; thus, once we got our Gap move we flattened out our last couple of plays on the market open. A Doji followed by a Gap is often a change of trend setup and this is commonly seen at the end of both up and downtrend moves in not only the market but also in individual issues. In addition the Doji printed on Wednesday was a backtest move right up against our Trendline off the March lows on the Nasdaq which provided a strong resistance point (see our first chart below). Both the DIA and SPY (see our 2nd/3rd charts below) gapped down after printing Doji's in right shoulders of potential Head/Shoulder Top Patterns which must be watched in the week ahead.
We gapped down Thursday morning on a much worse than anticipated jobs report. Expectations were for losses in the 350,000 area. We ended up having losses at 460,000. It's clear that employers are still laying off workers at a very intense pace. The market hated the news as seen by the selling that immediately took place in the futures market. Dow futures went from -35 to -115, while the SPX went from 4 to nearly 13 in the red. The gap down was for real as the sellers came in once the market opened. The bulls never had a chance. We gapped and ran and this is how you can recognize a gap is going to stick throughout the day. At times we can gap up or down but then things just churn.
That tells you the other side has caught up to which ever way the gap went often allowing for reversals. That was not to be today. We gapped and never looked back. As we approached that key 50-day exponential moving average at SPX 901, we spent over three hours just churning right on it. The bulls threw what they had at it in order to protect it but the bears held their ground allowing only for churn but no rally. This is normally bad news if you're bullish. If there are enough bulls to save the day the market will bounce hard as it approaches a key level of support. That just didn't happen. This allowed for a small breach and close below 901 at 896. The market has spoken but now the bears need to hold the market below 901 in order to gain deeper control and set their eyes on the big one at Sp 875. Once below 875, if they can get it done, they'll be able to breathe easier while the bulls suffer.
One of the critical events that took place on Thursday was the failure of the leaders to lead. Apple (AAPL), Google (GOOG), Baidu (BIDU), Priceline (PCLN), Amazon (AMZN) and many other technology leaders simply had terrible trading days. One red flag that had shown up recently was how little the MACD's had moved up on the most recent advance in the key sector charts, but also in these key leaders within those leading sector charts. When MACD's refuse to impulse higher on the leaders, it tells you to play more cautiously. When looking at charts such as the major leader GOOG, you can see this lack of advancement and how the MACD is now pointing lower, not to mention the fact that it's testing its 50-day exponential moving average for the second time in a very short period of time and they did that on a gap down, meaning there's massive overhead resistance just above Thursday's close. This suggests further weakness to come in this issue. Many other leaders are in the same position. This isn't good news if you're bullish. If GOOG breaks that 50 day exponential moving average at 406, today's low, then much lower prices are likely for this issue and therefore the Nasdaq as well. Something to watch very closely. 415 is now strong resistance.
Keep in mind that although it does appear we are making a transition from bull to bear, you never play it that way until you get the breakdown and failed retest from underneath by the bulls. That's where you see the true confirmation take place. When things look bad, it's so easy to just get bearish and say with certainty that things are only going to get worse. That may very well be the case but you never know and if you want to play with total appropriateness, you wait to see the move and failed retest from underneath.
Sentiment Analysis
There are an increasing number of bears and a decreasing number of bulls showing up as each week passes on all the major surveys we have come to respect. The changes are not dramatic nor are they at/near the levels seen at the March 2009 lows. We would need a lot more selling to increase the number of bears that usually tell us a market has reached a level of being overly pessimistic. The Vix, in fact, is quite low and that usually means a higher stock market. However, the market never seemed to take full advantage of this reality and now we can see the Vix chart is starting to diverge positive which suggests that things can turn around and head higher on this sentiment indicator which often means lower equity prices. We'll need a lot more fear to say we think the market could be putting in a significant bottom based purely on sentiment indicators. If the VIX takes out its 10 month downtrendline that would be another ominous sign for the bulls. In additon, market seasonality historically becomes poor as we move into the latter half of July.
Sector Watch
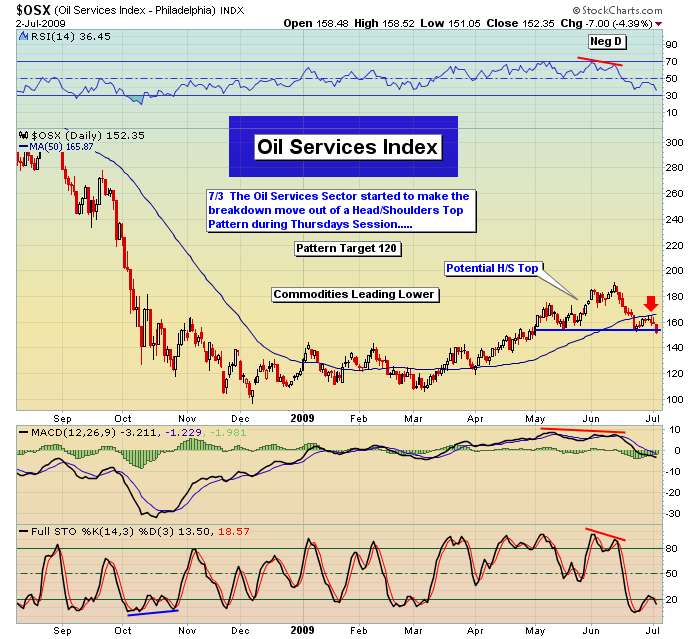
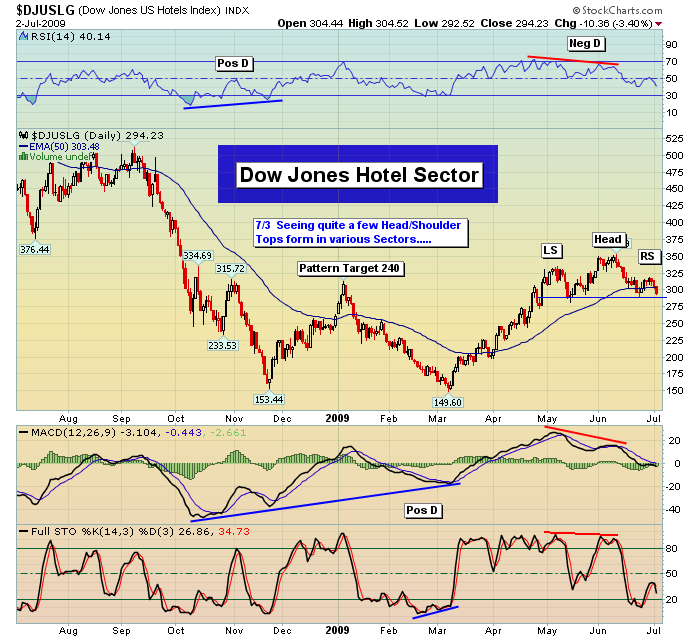
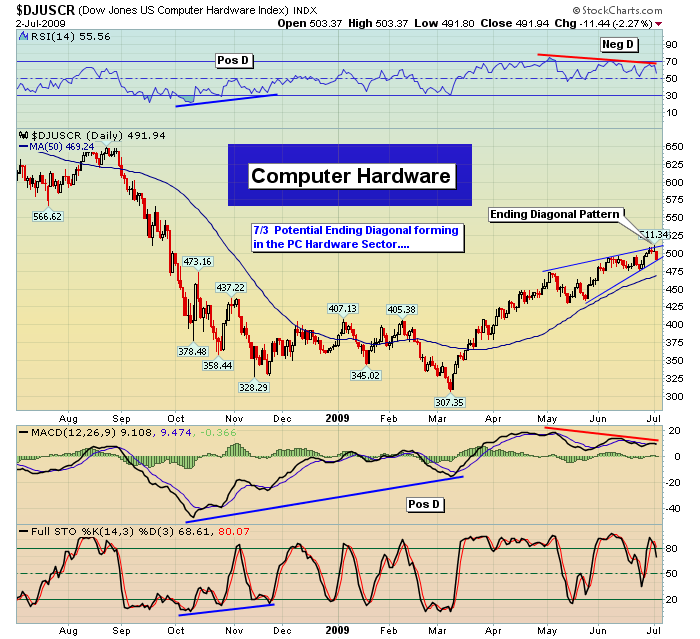
The Commodity area has been leading lower and there are some ominous signs in some of the sub sectors. We posted an Oil Service Index Daily chart below which shows a potential Head/Shoulder Top Pattern which broke down Thursday through its neckline area. During the week we noted successive failures on tests of the 50 EMA from underneath a bearish indication. In addition, other groups such as the Hotel Sector (see our 5th chart below) show a similar Head/Shoulder Top Pattern in place. If the consumer remains tapped out this group should be one of the first to stall out. Retail looks similar. Even some of the recent leading Tech Groups such as the Computer Hardware Sector (this includes AAPL...see our 6th chart below) hold potential as Ending Diagonal Patterns as the last few price highs have been putting in some Negative Divergence. The Banks/Financials, Transports and Retail Sectors all broke through respective 50 EMA's during the week another shot across the bow near term.
The Week Ahead
The week ahead will be critical for both bulls and bears alike. It should tell us definitively if the transition will indeed take place from a bull market rally back to the bear market. It won't take long from here to understand what's ahead for all of us. If we stay below 901 for a day or so, it's quite likely the Sp will pay a visit to the 875 neckline of support that is the dividing line between bullish and bearish for equities. A weak bounce off 875 would tell us that it too will likely fail in time. A strong bounce puts that in to question thus we'll need to watch the nature of a bounce off 875. Will the Macd impulse or be flat? Will price jump or simply get dragged up with small candlesticks?
The answer to those questions will be our guide and we will take positions based on what takes place. The bulls need to grab back that loss of that critical 901 level. If not, the bears will get braver by the moment and a visit to 875 will become a given. In addition keep watch on the Gaps left behind from Fridays session. We now expect strong resistance on bounces back to our 1824 Nasdaq Gap area which should provide an objective short entry point should we backtest that Gap area. Slow and easy here folks. Very dangerous times here. We may be back in the bear market and like the last one from 2007/2008, we want to protect you from it and actually make you money shorting when appropriate.
Have a great holiday weekend.
Peace
Jack Steiman
Jack Steiman is author of SwingTradeOnline.com ( www.swingtradeonline.com ). Former columnist for TheStreet.com, Jack is renowned for calling major shifts in the market, including the market bottom in mid-2002 and the market top in October 2007.
Sign up for a Free 30-Day Trial to SwingTradeOnline.com!
© 2009 SwingTradeOnline.com
Mr. Steiman's commentaries and index analysis represent his own opinions and should not be relied upon for purposes of effecting securities transactions or other investing strategies, nor should they be construed as an offer or solicitation of an offer to sell or buy any security. You should not interpret Mr. Steiman's opinions as constituting investment advice. Trades mentioned on the site are hypothetical, not actual, positions.
Jack Steiman Archive |
© 2005-2022 http://www.MarketOracle.co.uk - The Market Oracle is a FREE Daily Financial Markets Analysis & Forecasting online publication.