Charting Perspective - Upward Wedge Puzzle - What USA Index is this?
InvestorEducation / Learn to Trade Jul 06, 2009 - 04:46 AM GMTBy: Garry_Abeshouse
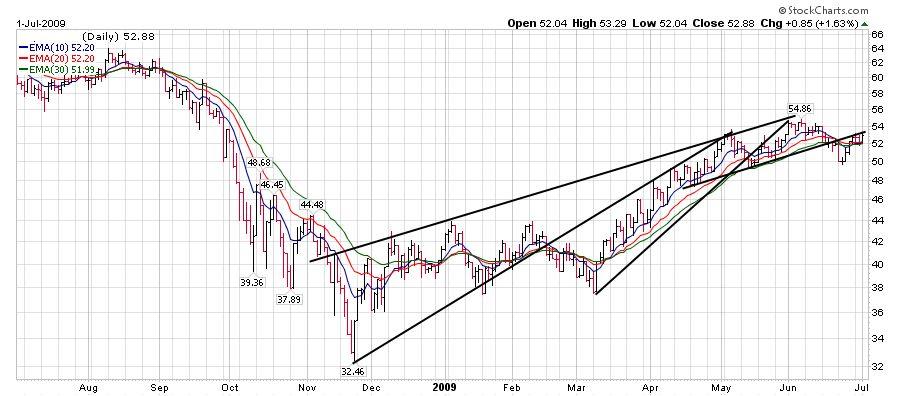
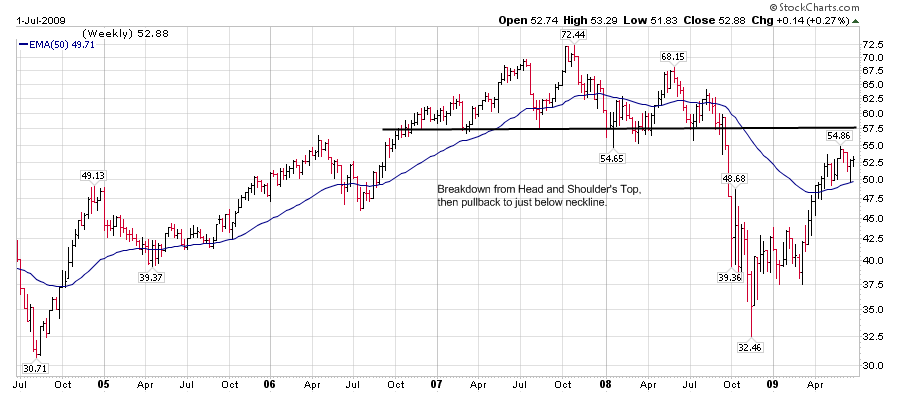
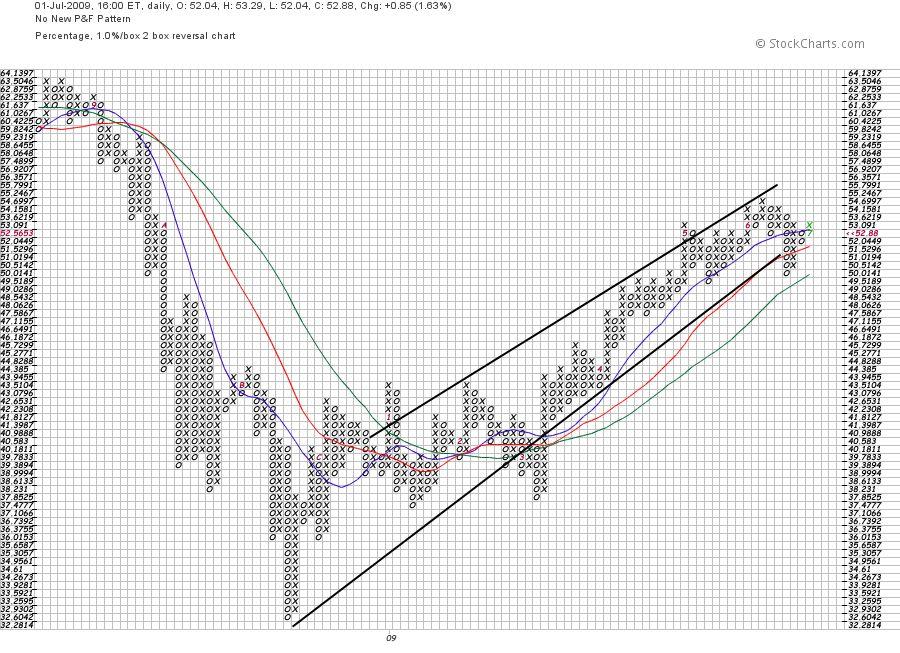
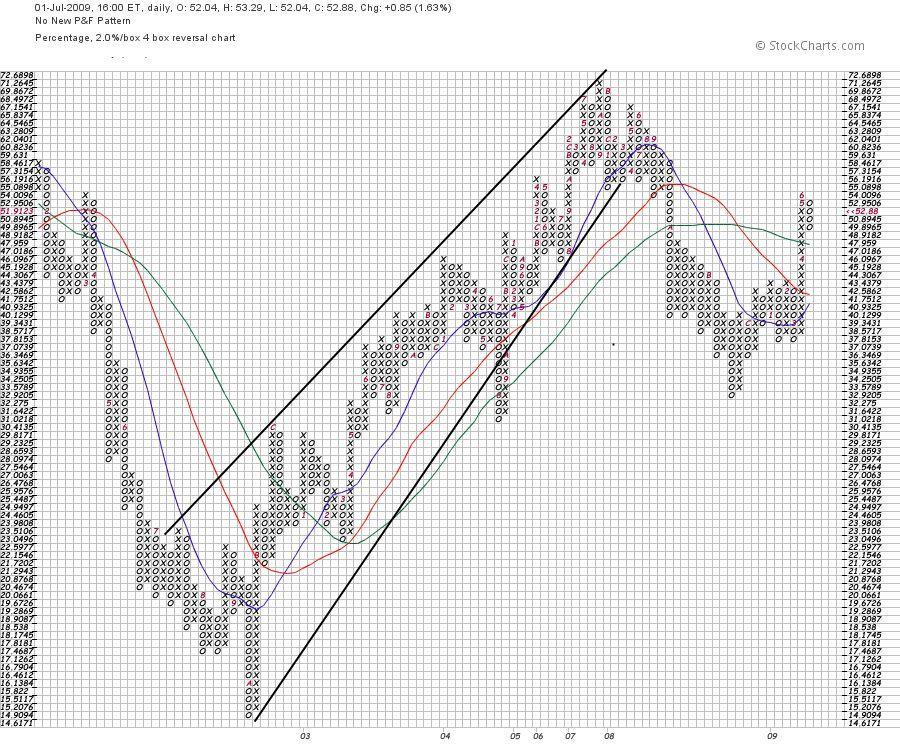
 The following charts are all of the same USA Index.
This index represents one of the most important market sectors in the USA and as you can see, it has an interesting history.
The price patterns displayed are well defined and the upward wedges on the daily chart are typical of ones
common at the moment over a broad spectrum of the USA equity market.
I would expect that whatever this index does in the near future, so will the rest of the market.
In my next Charting Perspective in a few days time, I shall let you know what this index is - if you are unable to find out in the meantime.


These charts alo illiustrate the upward wedge patterns discussed in my article on July 2nd 2009 titled Stockmarket Upward Wedge Patterns - Signs of the times
Garry Abeshouse
Technical Analyst.
Sydney
Australia
I have been practicing Technical Analysis since 1969, learning the hard way during the Australian Mining Boom. I was Head Chartist with Bain & Co, (now Deutsch Bank)in the mid 1970's and am now working freelance. I am currently writing a series of articles for the international "Your Trading Edge" magazine entitled "Market Cycles and Technical Analysis".
I have always specialised in medium to long term market strategies and after discovering the excellent Point & Figure Charts from Stockcharts.com in mid 2008, have concentrated on this style of charting ever since.
While concentrating on US markets, my emphasis is on tracking markets on a Global scale as money moves around the world, switching, forever switching in search of safety and maximum returns.
© 2005-2022 http://www.MarketOracle.co.uk - The Market Oracle is a FREE Daily Financial Markets Analysis & Forecasting online publication.


