


GOLD Futures Analysis & Trading Strategy July 6th, 2009
Commodities / Gold & Silver 2009 Jul 06, 2009 - 06:40 PM GMTBy: Florian_Grummes

 Gold Spotprice Analysis - Gold in USD (one ounce = US$931.50)
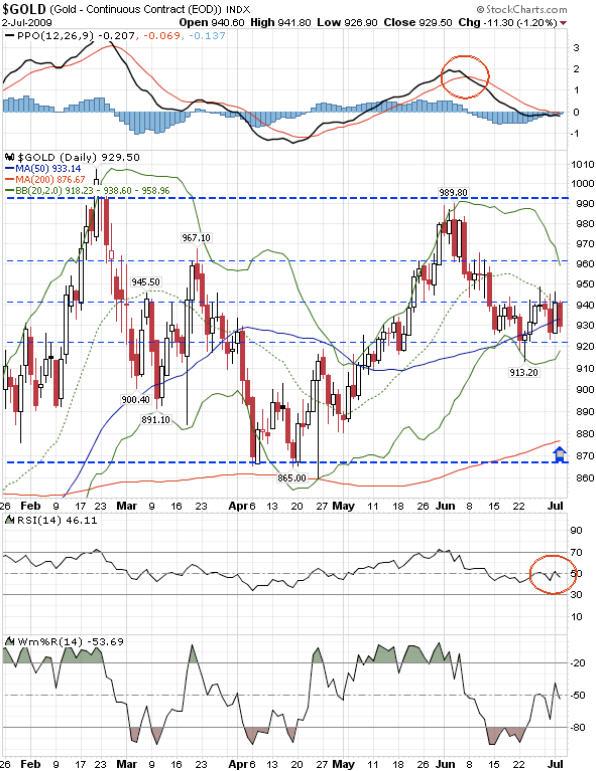
- During the last two weeks the price of gold moved sideways between US$948 and US$913. It looks like the correction since early june took at least a break. Exactly at the 61,8% Retracement of the last rally at US$912,70 the market found a shortterm bottom and Gold went up to nearly US$950 pretty quickly. At this level resistance was too strong and selling started again. At the end of last week Gold was down already more than 15 dollar closing at US$931.
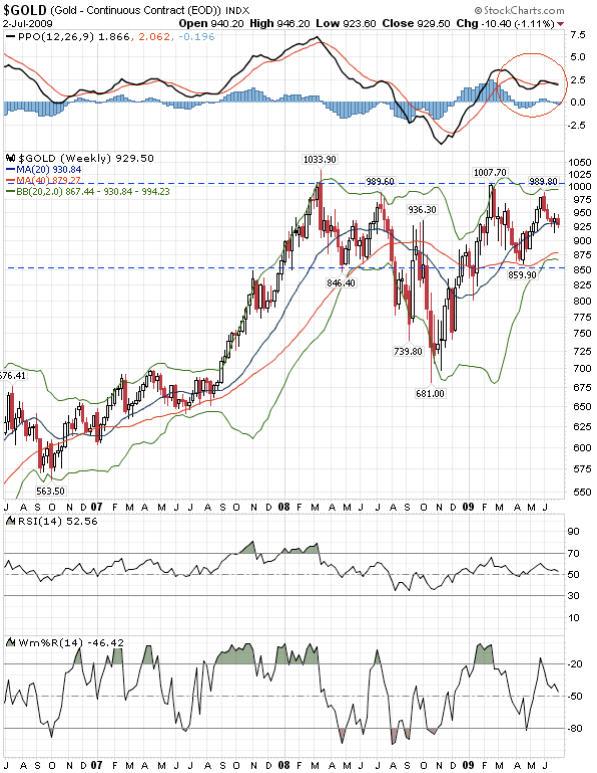
- In the bigger picture the correction since the all time high in March 2008 (US$1.037) is still in play. To end the correction a sustainable move above of the US$1.000 mark is necessary.
- Already for more than three weeks Gold is still oscillating around the rising 50d MA (US$933.14) between US$ 940 – 925. A typical summer season! Both Bollinger Bands are contracting slowly and the 200d MA (actually US$876,67) is movingparallel to the 50d MA. Both important moving averages are rising. In the midterm this is a quite positive technical picture and indicates higher prices after the summer break.
- Within the next weeks this unvolatile sideways market should continue. But expect a quick move below US$900 with a test of the 200d MA to shake out the weak hands. Probably around US$880-845 there will be a very good buying opportunity.
- On the other side a clear buy signal would be a rise above US$965-970. In that case the level of US$ 1.000 should be taken out soon. I believe that scenario is quite unlikely at the moment.
- The long term technical & fundamental perspective for gold is still super bullish. The next price targets for this longterm bullmarket are the Fibonacci‐Extensions of the correction since March 2008 at US$1.250 and US$1.600.
- The DowJones/Gold Ratio is now at 8.89 and omproved slightly in favour for gold. The news about the stockmarket & the economy getting worse again. During the coming summer weeks I do not expect a fast & heavy sell off here, but I do believe that a slow & steady decrease is the most probable scenario. I guess we will see another wave of deleveraging later this year in autumn before the inflation speculation including the CrackUpBoom will finally start.
- Long term I expect the price of gold to move towards parity to the Dow Jones (=1:1). The next primary cyclical change is still years away. This means we are still in a longterm bull market in gold and in a secular bear market in the broad stockmarket.
Gold in EUR (one ounce = 666.45€)
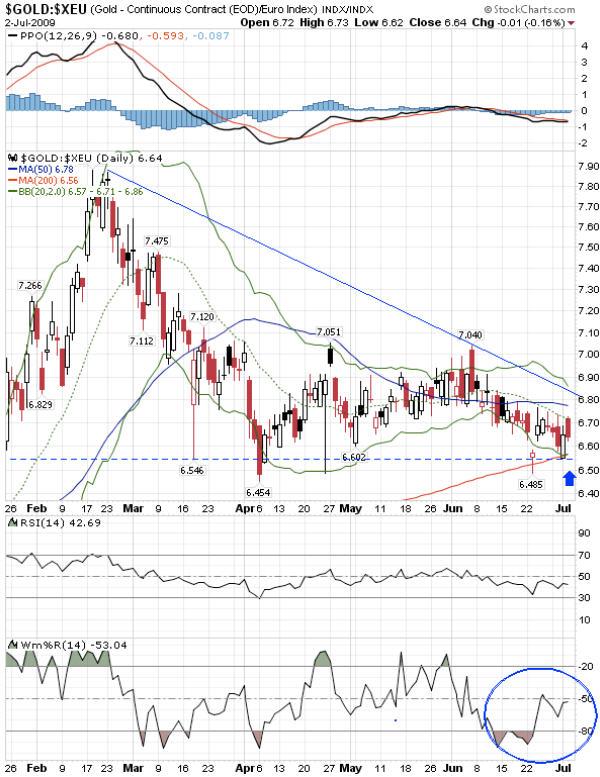
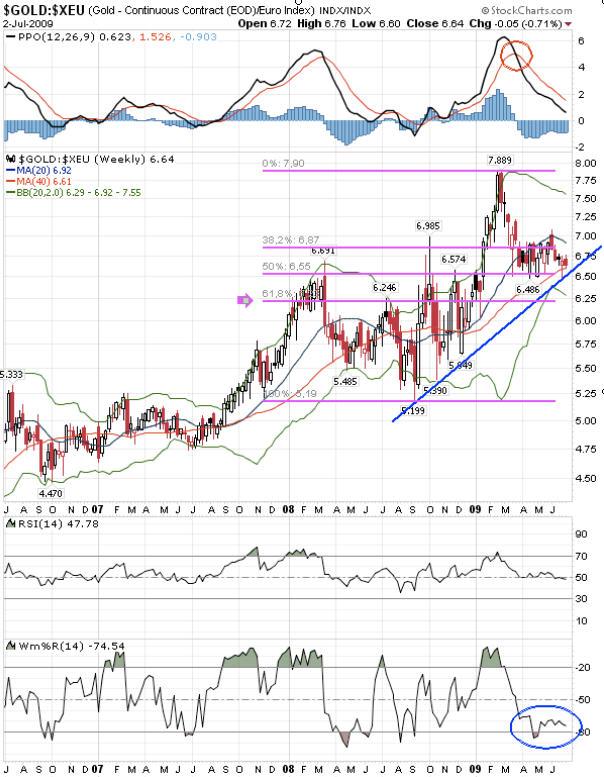
- EUR the Price of Gold decreased again since the last issue.
- The rising 200d MA (actually 656,00€) as the next important support is very close now.
- If this support fails, I expect weaker price down to the 625,00€ level.
- I see the current pricelevels under 670,00€ as a buying opportunity for EUR Investors. The bullion market (at least in germany) is pretty quiet again and most of the standard products are available. That will change during the next bull move to the upside.
Gold COT Situation
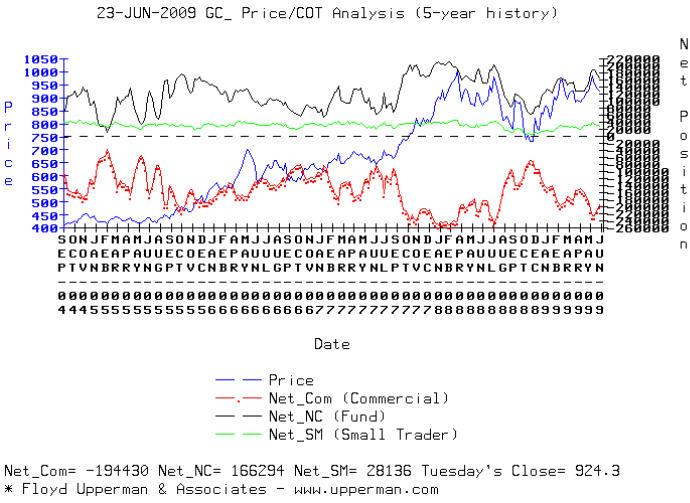
- Due to the holidays in US the COT data of last tuesday is not yet available. But the data of the week before is quite informative as well. The basic conclusion here is to stay very cautious on the longside.
- The well informed Commercials covered about 13.000 contracts of their short position so far. During last week they might have covered another few thousand. That is by far not enough for a sustainable longterm bottom.
- I still believe that the next big sustainable upleg in the price of gold will only start, if the commercials reduce their short positions to below or at least around 100.000 contracts. With prices below US$900 the commercials should start to cover much more of their shorts.
17.02.2009 = -196.360 ( PoG Low of the day = US$ 970 ) 10.03.2009 = -172.851 ( PoG Low of the day = US$ 892 ) 18.04.2009 = -153.419 ( PoG Low of the day = US$ 885 ) 19.05.2009 = -183.065 ( PoG Low of the day = US$ 920 ) 26.05.2009 = -208.136 ( PoG Low of the day = US$ 939 ) 02.06.2009 = -226.521 ( PoG Low of the day = US$ 970 ) 09.06.2009 = -225.047 ( PoG Low of the day = US$ 947 ) 16.06.2009 = -207.368 ( PoG Low of the day = US$ 929 ) 23.06.2009 = -194.430 ( PoG Low of the day = US$ 913 )
Gold Seasonality
- It’s July – the worst month for gold. The trading volume decrases and so do the prices of most of the markets.
- Personally I am out of the market and do not hold any shortterm trading positions. I am on holiday now. It is time to recharge soul, mind and body!
Gold Sentiment
- The sentiment cooled down already but I believe for gold to climb the wall of worry the weak hands have to be pushed out of the market once again. That should happen with a move below the US$900 level.
Conclusion
- As mentioned already the technical picture basically is quite positive. But the COT data as well as the seasonality do not support a new upmove within the next couple of weeks. Instead I expect a test of the area between US$ 875 – 900. Even a quick test of the very important support at US$ 845 is quite possible. If in this case the commercials will cover more of their short positions we can expect a new and this time successful attack of the US$ 1.000 level in autumn or winter
Goldmining stocks Analysis
Goldbugs Index USD (342.72 points)
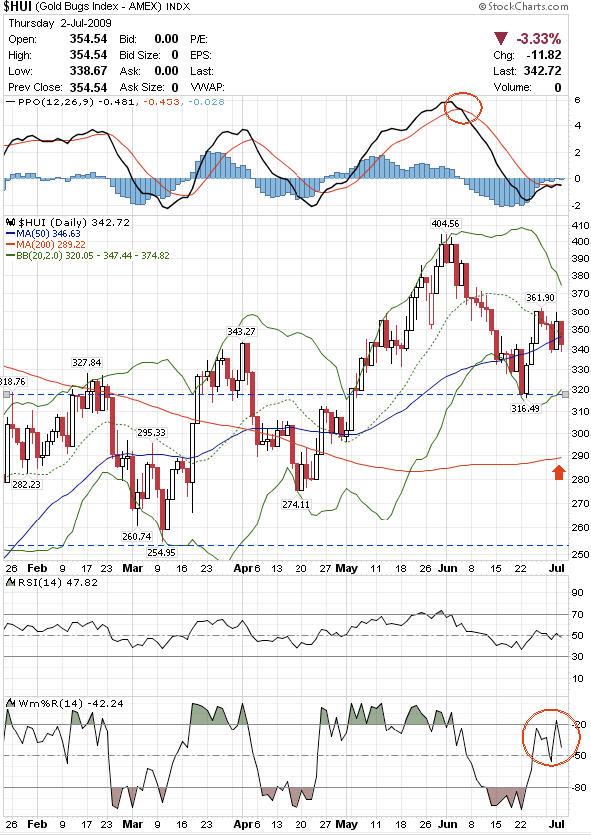
- Before the HUI started as expected to recover backup to the level of 360 another sell off took place down to 317 points. From here together with a recovery in the stock market and some short covering in the goldmarket the index went up again quickly to 360 point..
- But last week the HUI went down lower again. Last thursday the index for the unhedged Goldmining shares lost more then 3,3%.
- Similar to gold I expect at least a sideways movement around the 50d MA (actually 346.63 points) during the coming summer weeks.
- The flat 200d MA (actually 286.38) is still pretty far away and indicates further need for price correction. On the way down the lower Bollinger Band (actually 320.07) should be the first support.
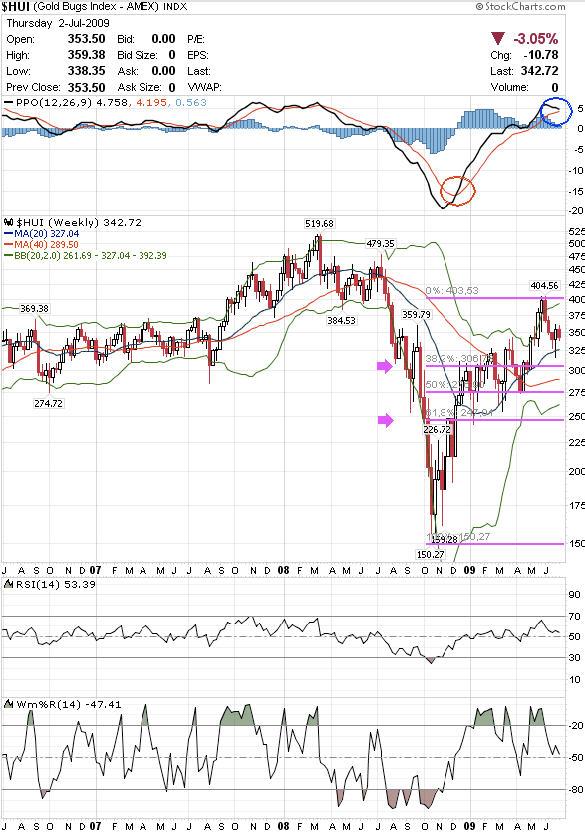
- A look on the weekly chart shows that a correction can go down to even 250 points over the next weeks and months. At 250 we can find the 61,8% Fibonacchi Retracement of the complete rally since last november. Most importantly the PPO/MACD indicator on the weekly chart clearly shows that there will come much better entry points for buying the gold mining sector again. The level of 250 points is identical with US$845 in gold: an important old top which might be tested one more time - now as a support.
If you would like to receive these free trading reports or my trading signals please visit this link: Free Weekly Trading Reports - Click Here
By Florian Grummes
www.TheSilverGoldSpot.com
Learn to Trade ETF's While Your Making Money Trading
© 2009 Copyright Florian Grummes - All Rights Reserved
Disclaimer: The above is a matter of opinion provided for general information purposes only and is not intended as investment advice. Information and analysis above are derived from sources and utilising methods believed to be reliable, but we cannot accept responsibility for any losses you may incur as a result of this analysis. Individuals should consult with their personal financial advisors.
Florian Grummes Archive |
© 2005-2022 http://www.MarketOracle.co.uk - The Market Oracle is a FREE Daily Financial Markets Analysis & Forecasting online publication.