


Natural Gas Set For Breakout In June
Commodities / Natural Gas Jun 05, 2007 - 01:25 AM GMTBy: Donald_W_Dony
 After months of consolidation, Natural Gas now appears ready to climb over a rigid resistance line and advance considerably higher. This move should also start driving gas stocks upward starting in June.
Natural gas (Chart 1) has been developing an impressive reversal formation for the past 15 months. Since March 2006, this commodity has staged a rapid decline from about $8.25 down to $4.25 and then back up to the main resistance level once again. However, the month of June appears to be the date for the thrust over this important line.
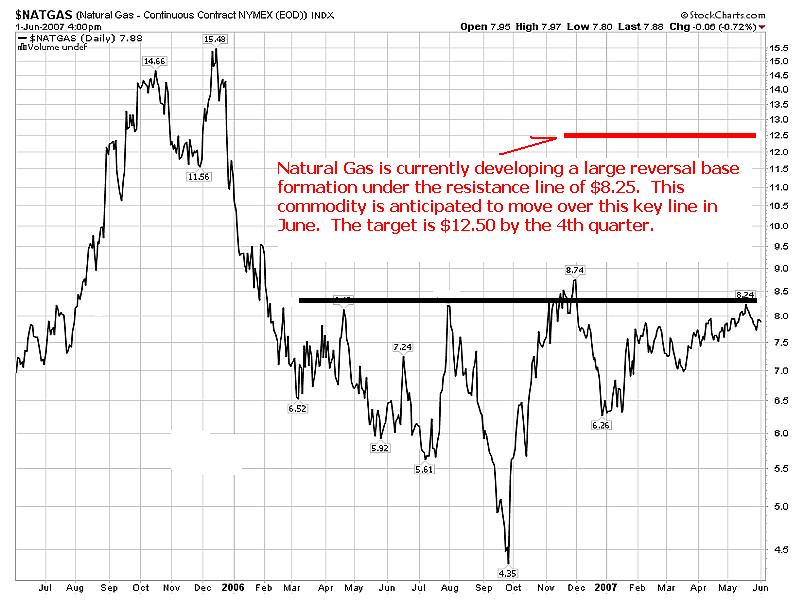
Some of the fundamental elements for the increasing underlying support are the expectations of hurricanes starting in June causing some disruptions in the supply chain, lower U.S. stock reserves levels than in 2006 and mounting seasonal demand from summer driving beginning this month.
The trading pattern for natural gas, though slowly trending up from expanding global consumption, is often directed, short-term, by weather conditions. Seasonal upward pressures typically begins in early summer and crest from September to December. The expectations from traders and investors toward future weather patterns particularly for summer and winter dictate much of the percentage rise or fall for this volatile commodity. With the current strong support, it is evident that demand will over shadow supply and force prices higher during the next 4-6 months.
Once above $8.25, the technical target is $12.50 by the 4th quarter.
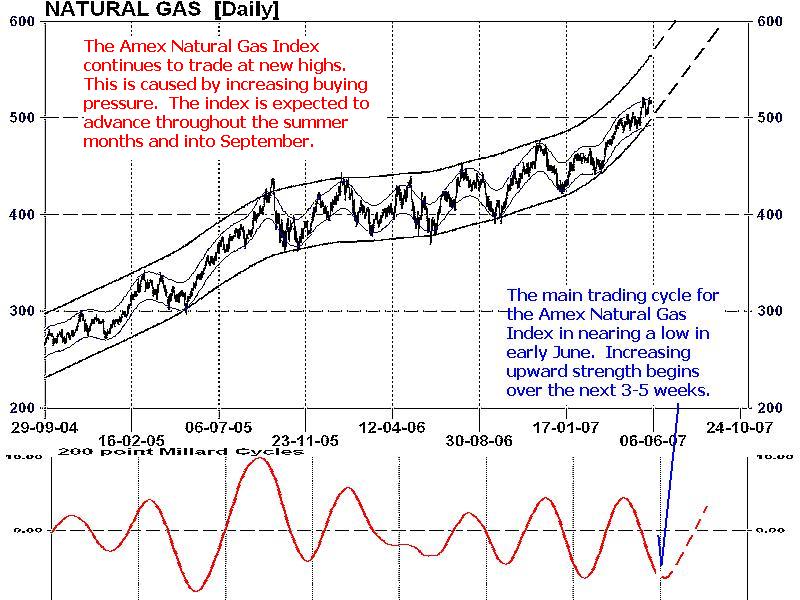
The Amex Natural Gas Index (symbol XNG) remains in a gradual escalating trend. This index of 15 gas producers and distributors (Chart 2) broke out of a 14-month consolidation in November 2006 and has pushed to new highs ever since. Technical evidence indicates on going upward pressure is anticipated in June and July which will translate into a projected target of 550 in 4-6 weeks.
MY CONCLUSIONS: Technical data and supporting fundamentals point towards an increase through the key $8.25 resistance line and toward elevated pricing 40%-50% above present levels. This expected move should provide considerable upward momentum for many natural gas stocks. This sector normally reaches annual lows between April and May and rallies to a peak from September to December. This short time frame can usually offer investors excellent returns in a defined period of time. Please refer to the May and June Technical Speculator newsletters for a complete list of recommended securities.
Your comments are always welcomed.
By Donald W. Dony, FCSI, MFTA
www.technicalspeculator.com
COPYRIGHT © 2007 Donald W. Dony
Donald W. Dony, FCSI, MFTA has been in the investment profession for over 20 years, first as a stock broker in the mid 1980's and then as the principal of D. W. Dony and Associates Inc., a financial consulting firm to present. He is the editor and publisher of the Technical Speculator, a monthly international investment newsletter, which specializes in major world equity markets, currencies, bonds and interest rates as well as the precious metals markets.
Donald is also an instructor for the Canadian Securities Institute (CSI). He is often called upon to design technical analysis training programs and to provide teaching to industry professionals on technical analysis at many of Canada's leading brokerage firms. He is a respected specialist in the area of intermarket and cycle analysis and a frequent speaker at investment conferences.
Mr. Dony is a member of the Canadian Society of Technical Analysts (CSTA) and the International Federation of Technical Analysts (IFTA).
© 2005-2022 http://www.MarketOracle.co.uk - The Market Oracle is a FREE Daily Financial Markets Analysis & Forecasting online publication.