


The Dot.Gold Investors Overconfidence
Commodities / Gold & Silver 2009 Jul 09, 2009 - 11:01 AM GMTBy: Frederic_Simons

 Projections and guesstimates by various newsletters and analysts where the price of gold will be in 6, 12 and 52 weeks, and various prices where Gold would be "cheap" according to those analysts are quite remarkable. Certainly in most cases not for their accuracy, but for their underlying misconceptions with regard to the movement of commodity-prices in general.
Oh yes, I can already hear you say, with gold it is different: it is the only real and "honest" money, and that one cannot compare precious gold to other commodities. This deepy ingrained overconfidence in ever-rising Gold prices reminds a bit of the year 2000 dot.com bubble.
What surprises most is the recklessness that is resulting from the belief in ever-rising gold prices. It can easily be seen when observing those price levels that are associated by various analysts (both amateur and professionals that is) as a "bargain" to buy or accumulate gold. While to the upside, those analysts virtually see no limit at all, the worst case scenario those same analysts might even think of seems to be a level of about 850-875. At these prices, gold is said to be "very cheap", a "lifetime buy", or at least offering "good value" or a "decent risk-reward ratio".
This notion seems very dangerous to me, especially in the current market climate, where very strong trends tend to emerge. Trends that are not forgiving to those lacking the right attitude concerning trading in general and with regard to the movement of prices in commodities in particular. These upbeat price projections are misleading for a lot of investors, because they are resulting in a wrong impression and illusion of safety, and may lead to serious financial losses. There is no security or commodity with a built-in guarantee that prices are always moving to the upside, not even in a secular bull market.
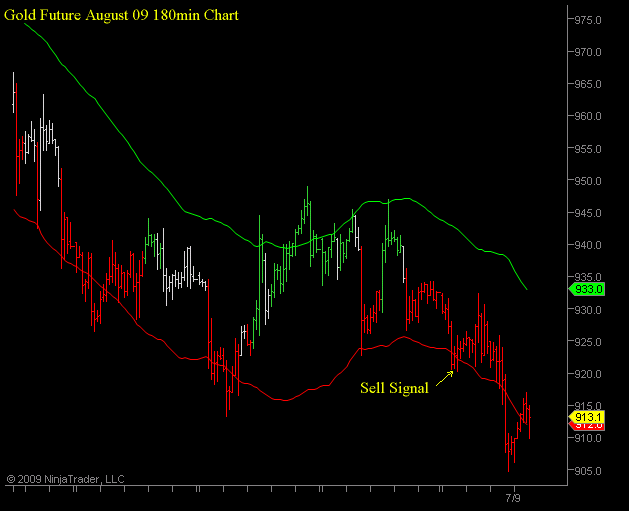
As you might have seen from previous market comments by Crossroads FX (click here for past newsletters), we use an approach that bases trade decisions on the actual behaviour of the price, not on fundamental aspects. For this purpose, we developed a proprietary indicator that finds out the line of least resistance both to the downside and to the upside, and prints them on the chart as a green line (buy line) and a red line (sell line). You can see on the following charts that if the price trades for 2 consecutive bars above the green line, rising prices are to be expected. Once the price trades for 2 bars below the red line, you should prepare for falling prices.
Using this approach, no analysis of Crossroads FX will ever disregard the most important aspect of trading: the actual behaviour of price. To the investor and trader, this means that the best part of any major trend will be captured, as there is no bias as to where prices might go. A buy signal will only be issued if prices are actually strong, and a sell signal can only occur if prices are really becoming pretty weak. Secondly, one of the biggest fallacies in trading, to try to capture the very expensive first and last eights of a move by catching a falling knife or calling a top is not even attempted.
In addition, the method used by Crossroads FX does not make price targets or predictions as to when and at what price a trend will end. This is because nobody can possible know that with accuracy over the long term.
Please do not get us wrong: we would be absolutely delighted to see gold prices rising vertically to 2500 USD. However, we would not mind if gold would plunge to 600 USD either, as our trading method would capture such a move as well.
Markets, and especially bull markets, tend to behave in a way that shakes the weak hands out before resuming its way up. Taking this into account, the overconfidence of numerous market analysts, that gold will not trade below 850 within the near future suggests that gold might actually do that, and perhaps even trade a lot lower. Gold is currently trending lower, and trends are reinforcing themselves, as selling tends to lead to more selling, and weak prices result in even weaker prices further on as leveraged bets are unwound.
As reported in an earlier gold market update, the August Gold Future Contract is currently on a sell-signal:
The big picture 300min chart is also looking bearish currently.
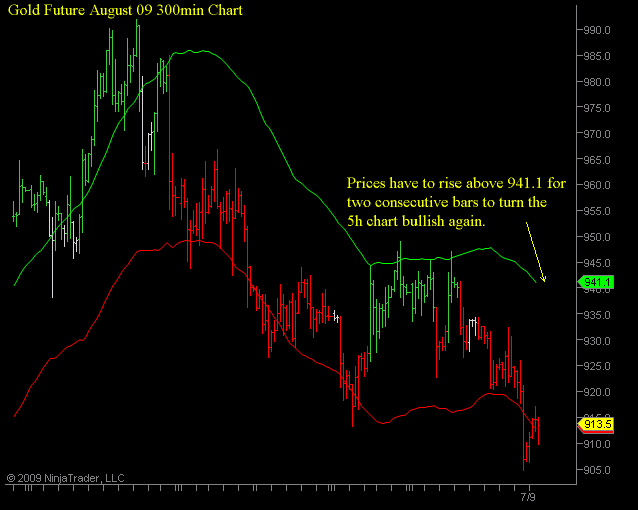
You can see on the charts above that the green buy-line is at 933 USD on the shorter term 180min chart, and at 941.1 on the 300min chart. This means that it would take prices to trade for 2 consecutive bars above these levels to endanger the current downtrend in the respective time frame, ie turn those charts bullish again.
As a conclusion, the line of least resistance points to lower prices in gold. Any overconfidence of gold bulls as to where "gold is cheap or offering good value" is reckless in our opinion and rather an argument that much lower prices may be ahead. To us, even though we would not place a bet on this impression because we are only listening to what our trading method reveals, the widespread overconfidence in ever-rising gold prices seems so pronounced that it would take a move below 750 or maybe even 700 USD in order to "clean" the market out of weak hands and thereby lay the foundations of a move of gold well above 1000 USD later on.
If you have any questions, please do not hesitate to contact us by writing an email to

By Frederic Simons
http://www.crossroadsfx.hostoi.com
© 2009 Copyright Frederic Simons - All Rights Reserved
Disclaimer: The above is a matter of opinion provided for general information purposes only and is not intended as investment advice. Information and analysis above are derived from sources and utilising methods believed to be reliable, but we cannot accept responsibility for any losses you may incur as a result of this analysis. Individuals should consult with their personal financial advisors.
© 2005-2022 http://www.MarketOracle.co.uk - The Market Oracle is a FREE Daily Financial Markets Analysis & Forecasting online publication.