Oversold Stock Market Due a Bounce
Stock-Markets / US Stock Markets Jul 12, 2009 - 05:59 AM GMTBy: Mike_Burk
 The good news is: The market is overdue for a bounce.
Short Term - As of Thursday's close the Russell 2000 (R2K or !RUT) had been down for 5 consecutive days for the 1st time since before the early March lows.
The chart below covers the past 6 months showing the Russell 2000 (R2K) in red and an indicator showing the percentage of the last 5 trading days that were up in green. The indicator touches the top of the chart then the trailing 5 trading days have been up and it touches the bottom of the chart then the trailing 5 trading days have been down. Dashed vertical lines have been drawn on the 1st trading day of each month.
The R2K was down 7 consecutive going into the early October low. From there it rallied 14.4% in 2 days. In late October it fell for 5 consecutive days to a new low and then rallied 20.1% in the next 5 days. It declined another 5 consecutive days to a new low in late November before rallying 22.8% in the following 5 days.
Since the early October low there have not been more than 5 consecutive days in either direction.
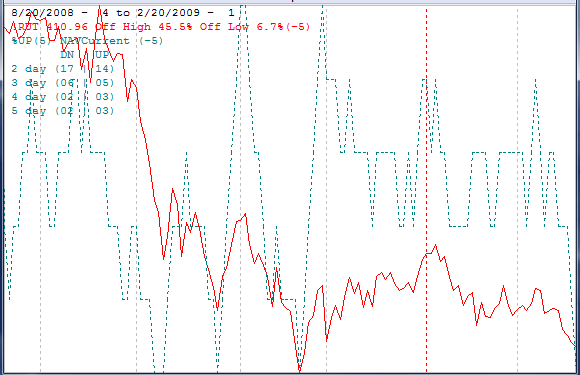
A rally beginning on Monday is not a sure thing. The market was down for 5 consecutive days prior to the crash on October 19, 1987. Government takeover of some banks this weekend could have triggered a climactic event, fortunately they moved to diffuse those rumors Friday.
Intermediate term
Last October 10 there were 2901 new lows on the NYSE, a record by any measure. On the November 20 retest there were 1894 new lows. On Friday's close, with the Dow Jones Industrial Average (DJIA) at a multiyear low, there were 555 new lows, a significant improvement. The problem is 555 new lows is enough to make a retest of this low (assuming this is the low) very likely.
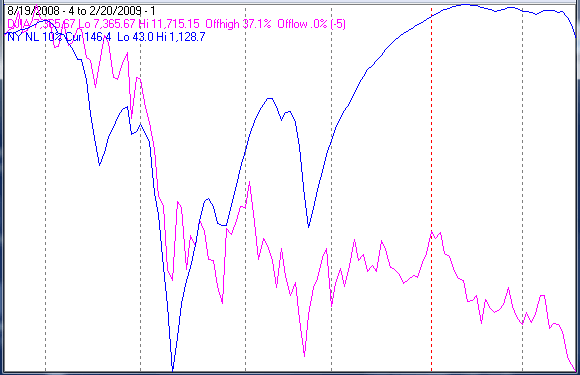
The chart below covers the past 6 months showing the DJIA in magenta and a 10% trend (19 day EMA) of NYSE new lows (NY NL) in blue. NY NL has been plotted on an inverted Y axis so decreasing new lows move the indicator upward (up is good).
This chart looks pretty good. The non confirmation of the new DJIA low by NY NL is not subtle. The problem is the level of NY NL was so extreme at the early October low that even the 1987 crash would look good by comparison. As long as NY NL is moving downward the market is very risky. The value of the indicator is 146 so there must be less than 146 new lows on the NYSE to turn this indicator upward.
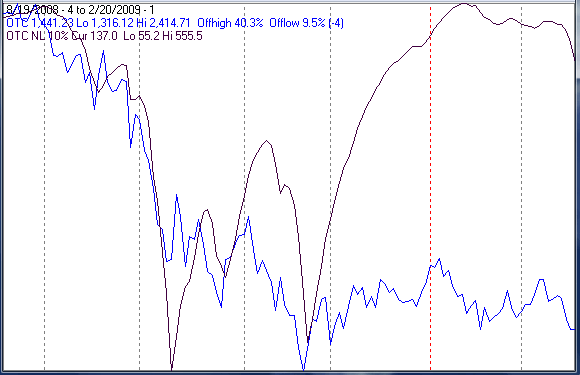
The next chart is similar to the one above, but calculated from NASDAQ data. The NASDAQ composite (OTC) is shown in blue and OTC NL is in black. The value of OTC NL is 137 so there must be less than 137 new lows on the NASDAQ to turn that indicator upward.
Seasonality
Next week includes the last 5 trading days of February during the 1st year of the Presidential Cycle.
The tables show the daily return on a percentage basis for the last 5 trading days of February during the 1st year of the Presidential Cycle. OTC data covers the period from 1963 - 2008 and SPX data from 1928 - 2008. There are summaries for both the 1st year of the Presidential Cycle and all years combined.
By all measures, next week has been weak and Monday has been the worst day of the week.
Report for the last 5 days of February.
The number following the year represents its position in the presidential cycle.
The number following the daily return represents the day of the week;
1 = Monday, 2 = Tuesday etc.
| OTC Presidential Year 1 | ||||||
| Day5 | Day4 | Day3 | Day2 | Day1 | Totals | |
| 1965-1 | 0.21% 5 | 0.61% 2 | 0.93% 3 | 0.54% 4 | -0.15% 5 | 2.15% |
| 1969-1 | -1.88% 1 | -0.74% 2 | -0.90% 3 | 0.53% 4 | -0.82% 5 | -3.82% |
| 1973-1 | -0.22% 4 | -1.08% 5 | -0.87% 1 | -1.21% 2 | 0.51% 3 | -2.88% |
| 1977-1 | -0.25% 2 | -0.40% 3 | -0.96% 4 | 0.06% 5 | -0.35% 1 | -1.89% |
| 1981-1 | 0.40% 1 | 0.46% 2 | 0.03% 3 | 1.10% 4 | 0.96% 5 | 2.94% |
| 1985-1 | -0.28% 5 | -0.78% 1 | 0.37% 2 | -0.31% 3 | 0.02% 4 | -0.98% |
| Avg | -0.45% | -0.51% | -0.47% | 0.03% | 0.06% | -1.32% |
| 1989-1 | -0.96% 3 | 0.14% 4 | -0.77% 5 | -0.26% 1 | 0.19% 2 | -1.65% |
| 1993-1 | -1.69% 1 | -0.16% 2 | 1.70% 3 | 0.70% 4 | 0.55% 5 | 1.11% |
| 1997-1 | 0.81% 1 | 0.19% 2 | -0.53% 3 | -2.08% 4 | -0.28% 5 | -1.89% |
| 2001-1 | -1.05% 4 | 0.78% 5 | 2.03% 1 | -4.36% 2 | -2.54% 3 | -5.14% |
| 2005-1 | -1.37% 2 | 0.05% 3 | 1.01% 4 | 0.67% 5 | -0.66% 1 | -0.32% |
| Avg | -0.85% | 0.20% | 0.69% | -1.07% | -0.55% | -1.58% |
| OTC summary for Presidential Year 1 1965 - 2005 | ||||||
| Averages | -0.57% | -0.08% | 0.18% | -0.42% | -0.23% | -1.12% |
| % Winners | 27% | 55% | 55% | 55% | 45% | 27% |
| MDD 2/28/2001 6.79% -- 2/28/1969 3.77% -- 2/27/1973 3.35% | ||||||
| OTC summary for all years 1963 - 2008 | ||||||
| Averages | -0.02% | 0.12% | 0.12% | -0.12% | -0.07% | 0.02% |
| % Winners | 54% | 57% | 54% | 59% | 50% | 54% |
| MDD 2/28/2001 6.79% -- 2/27/2007 4.64% -- 2/28/1969 3.77% | ||||||
| SPX Presidential Year 1 | ||||||
| Day5 | Day4 | Day3 | Day2 | Day1 | Totals | |
| 1929-1 | 1.10% 4 | 0.20% 1 | 0.16% 2 | 1.20% 3 | 1.35% 4 | 4.01% |
| 1933-1 | -4.70% 4 | 3.87% 5 | -5.25% 6 | -1.07% 1 | 2.35% 2 | -4.80% |
| 1937-1 | -2.12% 2 | 0.56% 3 | -0.39% 4 | 0.33% 5 | 0.17% 6 | -1.46% |
| 1941-1 | 0.82% 1 | 0.91% 2 | 0.20% 3 | -0.70% 4 | 0.40% 5 | 1.64% |
| 1945-1 | -0.21% 5 | -0.28% 6 | -0.21% 1 | 0.78% 2 | 0.70% 3 | 0.78% |
| Avg | -1.02% | 1.05% | -1.10% | 0.11% | 0.99% | 0.03% |
| 1949-1 | -0.95% 3 | -1.23% 4 | -0.28% 5 | 0.49% 6 | 1.18% 1 | -0.80% |
| 1953-1 | 0.23% 5 | 0.47% 2 | 0.62% 3 | 0.15% 4 | -0.19% 5 | 1.29% |
| 1957-1 | -0.34% 4 | -0.23% 1 | 0.16% 2 | -0.09% 3 | -0.35% 4 | -0.85% |
| 1961-1 | 0.06% 2 | 0.37% 4 | 0.40% 5 | 0.73% 1 | 0.22% 2 | 1.79% |
| 1965-1 | 0.19% 5 | 0.50% 2 | 0.61% 3 | 0.03% 4 | 0.26% 5 | 1.59% |
| Avg | -0.16% | -0.03% | 0.30% | 0.26% | 0.22% | 0.60% |
| 1969-1 | -1.19% 1 | -0.63% 2 | 0.48% 3 | -0.31% 4 | -0.01% 5 | -1.67% |
| 1973-1 | -0.22% 4 | -1.12% 5 | -0.86% 1 | -1.15% 2 | 0.70% 3 | -2.64% |
| 1977-1 | 0.00% 2 | -0.30% 3 | -0.59% 4 | -0.12% 5 | 0.34% 1 | -0.67% |
| 1981-1 | 0.61% 1 | 0.03% 2 | 0.89% 3 | 1.23% 4 | 0.90% 5 | 3.66% |
| 1985-1 | -0.46% 5 | -0.07% 1 | 1.08% 2 | -0.25% 3 | 0.26% 4 | 0.56% |
| Avg | -0.25% | -0.42% | 0.20% | -0.12% | 0.44% | -0.15% |
| 1989-1 | -1.71% 3 | 0.39% 4 | -1.68% 5 | 0.24% 1 | 0.36% 2 | -2.40% |
| 1993-1 | 0.23% 1 | -0.10% 2 | 1.40% 3 | 0.33% 4 | 0.24% 5 | 2.10% |
| 1997-1 | 1.06% 1 | 0.21% 2 | -0.78% 3 | -1.32% 4 | -0.54% 5 | -1.35% |
| 2001-1 | -0.20% 4 | -0.56% 5 | 1.75% 1 | -0.77% 2 | -1.43% 3 | -1.20% |
| 2005-1 | -1.45% 2 | 0.56% 3 | 0.79% 4 | 0.93% 5 | -0.64% 1 | 0.19% |
| Avg | -0.41% | 0.10% | 0.29% | -0.12% | -0.40% | -0.53% |
| SPX summary for Presidential Year 1 1929 - 2005 | ||||||
| Averages | -0.46% | 0.18% | -0.08% | 0.03% | 0.31% | -0.01% |
| % Winners | 40% | 55% | 60% | 55% | 70% | 50% |
| MDD 2/27/1933 7.21% -- 2/27/1973 3.30% -- 2/24/1989 2.99% | ||||||
| SPX summary for all years 1928 - 2008 | ||||||
| Averages | -0.15% | -0.09% | 0.06% | -0.03% | 0.08% | -0.12% |
| % Winners | 48% | 42% | 53% | 55% | 58% | 48% |
| MDD 2/27/1933 7.21% -- 2/26/1934 6.47% -- 2/26/1946 5.14% | ||||||
Money supply (M2)
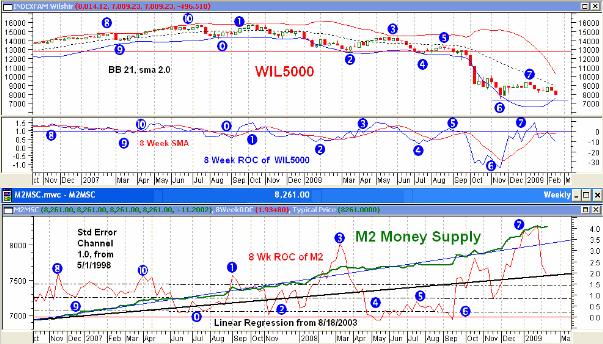
The money supply chart was provided by Gordon Harms. Money supply growth has continued to level off.
Conclusion
The market has been following the average seasonal pattern for February during the 1st year of the Presidential cycle very closely and next week has, on average been very weak. However, over the past 2 weeks most of the major indices have been down nearly 10% and are extremely oversold, a bounce is likely.
I expect the major indices to be higher on Friday February 27 than they were on Friday February 20.
Thank you,
By Mike Burk
To subscribe to this report : http://alphaim.net/signup.html
Gordon Harms produces a Power Point for our local timing group. You can get a copy of that at: http://www.stockmarket-ta.com/ .
Disclaimer: Mike Burk is an employee and principal of Alpha Investment Management (Alpha) a registered investment advisor. Charts and figures presented herein are believed to be reliable but we cannot attest to their accuracy. Recent (last 10-15 yrs.) data has been supplied by CSI (csidata.com), FastTrack (fasttrack.net), Quotes Plus (qp2.com) and the Wall Street Journal (wsj.com). Historical data is from Barron's and ISI price books. The views expressed are provided for information purposes only and should not be construed in any way as investment advice. Furthermore, the opinions expressed may change without notice.
Mike Burk Archive |
Oversold Stocks Entering Seasonally Strong Time Period
 The good news is: The market is deeply oversold as we enter a brief, but strong seasonal period.
Short Term - Most of the major indices had been down for 6 consecutive days through last Monday's low. Tuesday's rally was followed by 3 consecutive down days as of Friday's low. By virtually all breadth measures, the downside has been exhausted.
The chart below covers the past 3 months showing the S&P 500(SPX) in red and an indicator showing the ratio of NYSE advancing issues to advancing + declining issues (ADV / (ADV + DEC)). Dashed vertical lines have been drawn on the 1st trading day of each week and each month. Dashed horizontal lines have been drawn at 10% levels for the indicator.
The indicator hit its low for the period on February 18. It made a slightly higher low when the index hit a new low last Monday then it made a much higher low as the index hit a new multi year low on Friday.
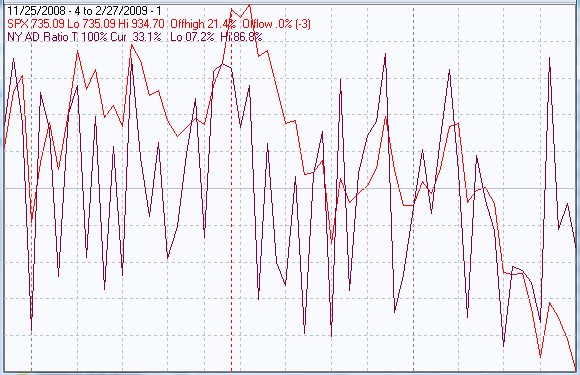
These progressive non confirmations are a positive. There are similar non confirmations from virtually all of the breadth derived indicators on both the NYSE and the NASDAQ.
Intermediate term
Last October 10 there were 2901 new lows on the NYSE, a record by any measure. On the November 20 retest there were 1894 new lows. A week ago Friday (February 20) there were 555 new lows and on Monday's low there were 395 new lows. At Friday's close, with the Dow Jones Industrial Average (DJIA) and SPX at a new multiyear lows, there were only 333 new lows. The 555 new lows on February 20, is enough to make another retest in the next few months very likely. In the shorter term, progressively fewer new lows as the indices decline, is a short term positive.
Since the November 20 low the secondaries have been outperforming the blue chips and that is a positive.
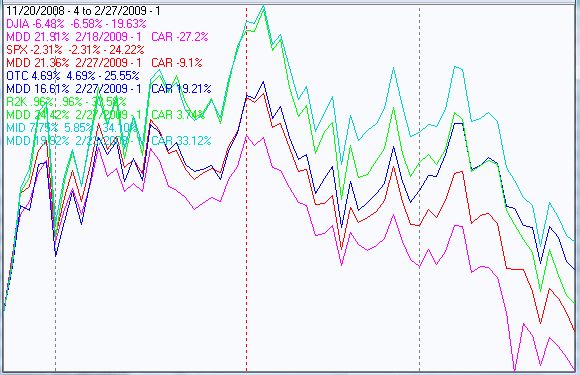
The chart below covers the period from the November 20 low through last Friday showing the major broad based indices on semi log scales.
The blue chip DJIA and SPX hit new multi year lows on Friday while the NASDAQ composite (OTC), S&P mid cap (MID) and Russell 2000 (R2K) remained above their November lows.
The annualized return for the indices since the November lows is:
| DJIA | -27.2% |
| SPX | -9.1% |
| OTC | +19.2% |
| R2K | +3.7% |
| MID | +33.1% |
Seasonality
Next week includes the first5 trading days of March during the 1st year of the Presidential Cycle.
The tables show the daily return on a percentage basis for the first 5 trading days of March during the 1st year of the Presidential Cycle. OTC data covers the period from 1963 - 2008 and SPX data from 1928 - 2008. There are summaries for both the 1st year of the Presidential Cycle and all years combined.
By all measures, next week has been positive and during the 1st year of the Presidential Cycle returns have been about double the average of all years combined.
In early March 1933 FDR, in the 1st year of his presidency, declared a 4 day bank holiday and the markets were closed as well as the banks. When the markets reopened on March 15, the DJIA jumped 15.34% and the SPX 16.61% in one day.
First 5 days of March.
The number following the year represents its position in the presidential cycle.
The number following the daily return represents the day of the week;
1 = Monday, 2 = Tuesday etc.
| OTC Presidential Year 1 | ||||||
| Day1 | Day2 | Day3 | Day4 | Day5 | Totals | |
| 1965-1 | 0.25% 1 | -0.23% 2 | -0.12% 3 | 0.21% 4 | -0.10% 5 | 0.00% |
| 1969-1 | -0.13% 1 | -0.16% 2 | 0.40% 3 | 0.07% 4 | -1.87% 5 | -1.70% |
| 1973-1 | -0.73% 4 | 0.49% 5 | 0.37% 1 | 1.13% 2 | 0.30% 3 | 1.55% |
| 1977-1 | 0.60% 2 | 0.05% 3 | 0.36% 4 | 0.57% 5 | 0.10% 1 | 1.68% |
| 1981-1 | 0.53% 1 | -0.36% 2 | 0.20% 3 | 0.15% 4 | 0.42% 5 | 0.95% |
| 1985-1 | 1.05% 5 | -0.03% 1 | 0.01% 2 | -0.57% 3 | -0.79% 4 | -0.34% |
| Avg | 0.26% | 0.00% | 0.27% | 0.27% | -0.37% | 0.43% |
| 1989-1 | 0.02% 3 | 0.68% 4 | 0.36% 5 | 0.56% 1 | -0.02% 2 | 1.61% |
| 1993-1 | -0.19% 1 | 1.23% 2 | 0.91% 3 | -0.47% 4 | 0.09% 5 | 1.58% |
| 1997-1 | 0.17% 1 | 0.40% 2 | 0.96% 3 | -1.03% 4 | -0.27% 5 | 0.22% |
| 2001-1 | 1.47% 4 | -3.01% 5 | 1.19% 1 | 2.87% 2 | 0.88% 3 | 3.40% |
| 2005-1 | 0.95% 2 | -0.18% 3 | -0.44% 4 | 0.59% 5 | 0.95% 1 | 1.87% |
| Avg | 0.48% | -0.18% | 0.60% | 0.51% | 0.33% | 1.74% |
| OTC summary for Presidential Year 1 1965 - 2005 | ||||||
| Averages | 0.36% | -0.10% | 0.38% | 0.37% | -0.03% | 0.99% |
| % Winners | 73% | 45% | 82% | 73% | 55% | 82% |
| MDD 3/2/2001 3.01% -- 3/7/1969 1.87% -- 3/7/1985 1.38% | ||||||
| OTC summary for all years 1963 - 2008 | ||||||
| Averages | 0.28% | -0.01% | 0.29% | -0.07% | -0.04% | 0.45% |
| % Winners | 64% | 50% | 70% | 58% | 51% | 63% |
| MDD 3/7/1980 7.49% -- 3/6/1968 4.86% -- 3/5/1982 3.43% | ||||||
| SPX Presidential Year 1 | ||||||
| Day1 | Day2 | Day3 | Day4 | Day5 | Totals | |
| 1929-1 | 0.94% 5 | -0.23% 6 | -1.09% 1 | -0.67% 2 | -1.58% 3 | -2.63% |
| 1933-1 | 1.94% 3 | -2.08% 4 | 3.36% 5 | 16.61% 3 | 1.76% 4 | 21.60% |
| 1937-1 | 0.00% 1 | 1.38% 2 | 1.15% 3 | -0.92% 4 | 1.31% 5 | 2.92% |
| 1941-1 | -0.20% 6 | -1.31% 1 | 0.51% 2 | -0.61% 3 | 1.95% 4 | 0.33% |
| 1945-1 | 0.14% 4 | -0.63% 5 | 0.00% 6 | 0.49% 1 | 0.49% 2 | 0.49% |
| Avg | 0.56% | -0.57% | 0.79% | 2.98% | 0.78% | 4.54% |
| 1949-1 | 0.62% 2 | -0.27% 3 | -0.14% 4 | 0.14% 5 | 0.95% 6 | 1.30% |
| 1953-1 | 0.12% 1 | 0.27% 2 | -0.85% 3 | 0.04% 4 | 0.19% 5 | -0.23% |
| 1957-1 | 1.11% 5 | 0.73% 1 | 0.36% 2 | 0.25% 3 | -0.27% 4 | 2.18% |
| 1961-1 | -0.02% 3 | 0.66% 4 | 0.16% 5 | 0.16% 1 | -0.91% 2 | 0.05% |
| 1965-1 | -0.21% 1 | 0.17% 2 | -0.16% 3 | -0.32% 4 | -0.21% 5 | -0.72% |
| Avg | 0.32% | 0.31% | -0.12% | 0.05% | -0.05% | 0.52% |
| 1969-1 | 0.25% 1 | 0.96% 2 | 0.39% 3 | -1.01% 4 | -0.05% 5 | 0.54% |
| 1973-1 | -0.56% 4 | 1.11% 5 | 0.36% 1 | 1.26% 2 | 0.31% 3 | 2.47% |
| 1977-1 | 0.84% 2 | -0.27% 3 | 0.49% 4 | 0.32% 5 | 0.05% 1 | 1.43% |
| 1981-1 | 0.56% 1 | -1.10% 2 | 0.23% 3 | -0.71% 4 | -0.06% 5 | -1.08% |
| 1985-1 | 1.13% 5 | -0.64% 1 | 0.09% 2 | -0.87% 3 | -0.63% 4 | -0.91% |
| Avg | 0.45% | 0.01% | 0.31% | -0.20% | -0.08% | 0.49% |
| 1989-1 | -0.61% 3 | 0.99% 4 | 0.42% 5 | 1.25% 1 | -0.32% 2 | 1.74% |
| 1993-1 | -0.31% 1 | 1.33% 2 | 0.30% 3 | -0.43% 4 | -0.27% 5 | 0.62% |
| 1997-1 | 0.57% 1 | -0.55% 2 | 1.40% 3 | -0.43% 4 | 0.80% 5 | 1.79% |
| 2001-1 | 0.10% 4 | -0.57% 5 | 0.59% 1 | 1.00% 2 | 0.65% 3 | 1.77% |
| 2005-1 | 0.57% 2 | -0.03% 3 | 0.03% 4 | 0.96% 5 | 0.26% 1 | 1.79% |
| Avg | 0.06% | 0.24% | 0.55% | 0.47% | 0.22% | 1.54% |
| SPX summary for Presidential Year 1 1929 - 2005 | ||||||
| Averages | 0.35% | 0.00% | 0.38% | 0.83% | 0.22% | 1.77% |
| % Winners | 65% | 45% | 75% | 55% | 55% | 75% |
| MDD 3/6/1929 3.52% -- 3/2/1933 2.08% -- 3/7/1985 2.03% | ||||||
| SPX summary for all years 1928 - 2008 | ||||||
| Averages | 0.22% | 0.17% | 0.19% | 0.18% | 0.00% | 0.75% |
| % Winners | 65% | 55% | 63% | 53% | 51% | 63% |
| MDD 3/7/1980 5.95% -- 3/6/1942 5.12% -- 3/6/1935 3.87% | ||||||
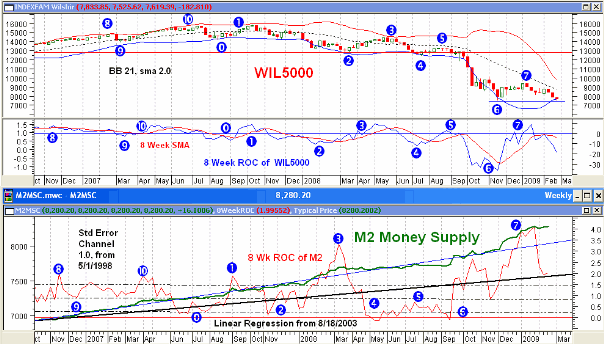
Money supply (M2)
The money supply chart was provided by Gordon Harms. Money supply growth has continued to level off.
March
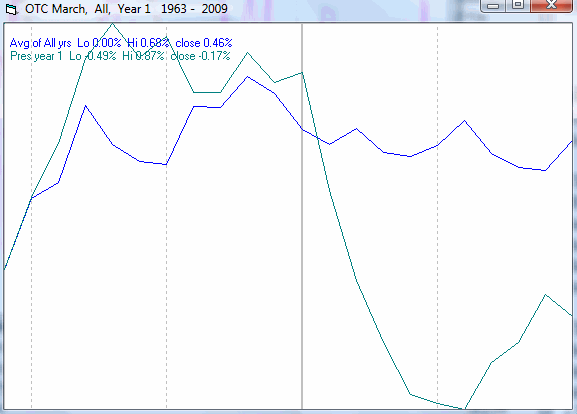
Since 1963 the OTC in March has been in the lower third of monthly performance averages, however, during the 1st year of the Presidential Cycle March is second only to February as the worst month of the year, up 36% of the time with an average return of -1.9%.
The average month has 21 trading days. The chart below has been calculated by averaging the daily percentage change of the OTC for each of the 1st 11 trading days and each of the last 10. In months when there were more than 21 trading days some of the days in the middle were not counted. In months when there were less than 21 trading days some of the days in the middle of the month were counted twice. Dashed vertical lines have been drawn after the 1st trading day and at 5 trading day intervals after that. The line is solid on the 11th trading day, the dividing point.
The blue line shows the average of all years since 1963 while the green line shows the average during the 1st year of the Presidential Cycle.
Since 1928 the SPX has been up 59% of the time in March with an average gain of 0.2% putting it ahead of February, May and September. During the 1st year of the Presidential Cycle the SPX has been up 50% of the time with an average loss of 0.4% putting it ahead of February, September and October.
The chart below is similar to the one above except it shows the daily performance over all years of the SPX in March in red and the performance during the 1st year of the Presidential Cycle in green.
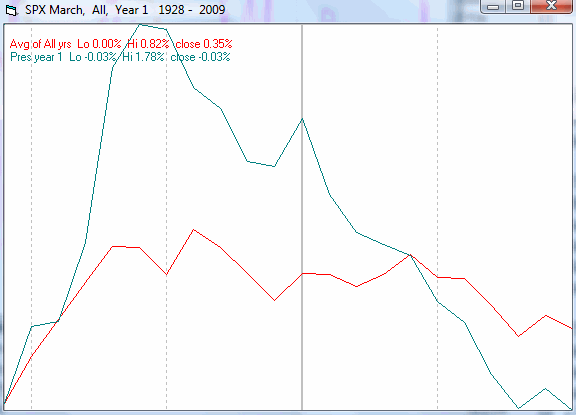
The March charts look very similar to the February charts, i.e., a sharp rally at the beginning of the month followed by a decline over the rest of the month.
Conclusion
The market is extremely oversold and followed the average seasonal pattern for February during the 1st year of the Presidential cycle very closely. Seasonally, next week has been, on average, strong. A bounce over the next week or so would fit the seasonal pattern and relieve the oversold condition. After that the seasonal pattern and the high level of new lows make new index lows likely.
I expect the major indices to be higher on Friday March 6 than they were on Friday February 27.
This report is free to anyone who wants it, so please tell your friends. They can sign up at: http://alphaim.net/signup.html . If you signed up in the past 3 weeks, you will have to do it again because the server ate all subscription applications during that period.
Last weeks positive forecast expecting a bounce from extremely oversold conditions was a miss.
Thank you,
By Mike Burk
To subscribe to this report : http://alphaim.net/signup.html
Gordon Harms produces a Power Point for our local timing group. You can get a copy of that at: http://www.stockmarket-ta.com/ .
Disclaimer: Mike Burk is an employee and principal of Alpha Investment Management (Alpha) a registered investment advisor. Charts and figures presented herein are believed to be reliable but we cannot attest to their accuracy. Recent (last 10-15 yrs.) data has been supplied by CSI (csidata.com), FastTrack (fasttrack.net), Quotes Plus (qp2.com) and the Wall Street Journal (wsj.com). Historical data is from Barron's and ISI price books. The views expressed are provided for information purposes only and should not be construed in any way as investment advice. Furthermore, the opinions expressed may change without notice.
Mike Burk Archive |
Stock Market Extreme Oversold Level Points to Bear Market Rally
 The good news is: The dollar is on a tear, closing at a 2 ½ year high Friday.
Short Term - In the past 6 months all of the major indices have fallen between 40% and 60%. This includes 3 brief, but impressive 20+% rallies following the 2 October lows and the November low.
Here are some historical comparisons for 6 month periods:
| High date | Low date | Amount of decline | Comments |
| 8/2008 | 3/6/2009 | 47.5% | Most recent 6 months of a 56% decline that began 10/2007. |
| 2/2002 | 7/23/2002 | 31.8% | Last 5mo of a 48% decline that began 3/2000. |
| 5/2001 | 9/11/2001 | 26.4% | |
| 7/1998 | 8/31/1998 | 19.3% | |
| 7/1990 | 10/11/1990 | 19.9% | |
| 8/1987 | 12/4/1987 | 33.5% | Brief |
| 4/1974 | 10/1/1974 | 33.1% | Last part of a 2 yr. 48% decline |
| 11/1969 | 5/26/1970 | 26.1% | Last part of a 1.5 yr 36% decline. |
| 4/1966 | 10/7/1966 | 20.8% | |
| 12/1961 | 6/14/1962 | 25.2% | |
| 7/1957 | 10/21/1957 | 20.3% | |
| 5/1946 | 11/22/1946 | 26.6% | |
| 10/1941 | 4/28/1942 | 26.8% | |
| 5/1940 | 25% | One of the sharpest 1 mo declines ever. | |
| 11/1938 | 4/10/1939 | 24.3% | |
| 8/1937 | 11/22/1937 | 40.8% | Last part of a 45% decline that began in March. |
| 2/1933 | 7/27/1934 | 27.2% | |
| 9/1932 | 2/27/1933 | 40.6% | Followed a 2mo 110% advance from the July 1932 low. |
| 3/1932 | 6/1/1932 | 51% | Last part of a 2.5 yr 83% decline. |
| 3/1930 | 6/24/1930 | 25.3% | Followed a 19% advance from the crash low and was followed by a 1 mo 16% advance. |
| 9/29 | 11/13/1929 | 44.7% | Still the mother of all crashes. |
Measured by the SPX, the current 6 month decline has been exceeded only once by the 51% decline going into the 1932 low. All major bear markets have accelerated to the downside in their later stages. Maybe we are nearing the end.
Intermediate term
Last Friday there were 827 new lows on the NYSE and 567 on the NASDAQ, the highest numbers since the November 21 low. Although these numbers were substantially less than the November 21 numbers (1527 NYSE - 1109 NASDAQ) they are high enough to imply, at least a retest (assuming a rally from here).
The chart below covers the past year showing the SPX in red and a 10% trend (19 day EMA) of NYSE new lows (NY NL) in blue. NY NL has been plotted on an inverted Y axis so decreasing new lows moves the indicator upward (up is good). Dashed vertical lines have been drawn on the 1st trading day of each month.
The indicator is falling sharply and currently has a value of 389 so it will take less than 389 NYSE new lows to move the indicator upward. There will be no tradable rally until that indicator begins to move upward.
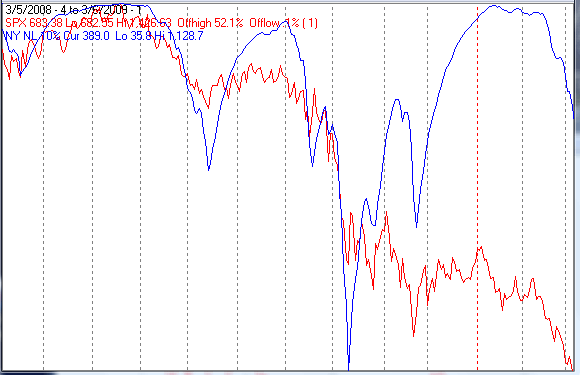
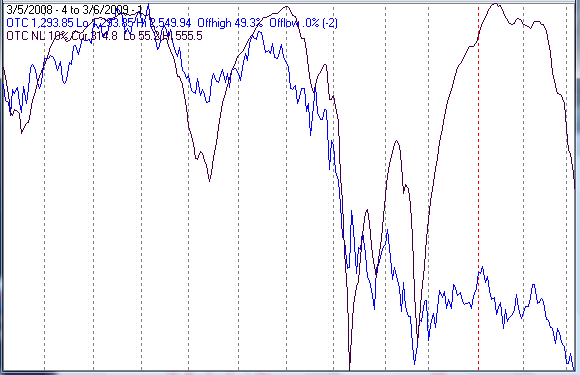
The chart below is similar to the one above except is shows the NASDAQ composite (OTC) in blue and OTC NL calculated from NASDAQ new lows in black.
The value of OTC NL is 314 so it will take less than 314 NASDAQ new lows to turn that indicator upward.
Seasonality
Next week includes the week prior to the 2nd Friday of March during the 1st year of the Presidential Cycle.
The tables show the daily return on a percentage basis for the week prior to the 2nd Friday of March during the 1st year of the Presidential Cycle. OTC data covers the period from 1963 - 2008 and SPX data from 1953 - 2008. There are summaries for both the 1st year of the Presidential Cycle and all years combined. Prior to 1953 the market traded 6 days a week so that data has been ignored.
Historically next week has been unremarkable, a little weaker during the 1st year of the Presidential Cycle than the overall averages.
Report for the week before the 2nd Friday of March
The number following the year is the position in the presidential cycle.
Daily returns from Monday to 2nd Friday.
| OTC Presidential Year 1 | ||||||
| Year | Mon | Tue | Wed | Thur | Fri | Totals |
| 1965-1 | -0.37% | 0.10% | -0.04% | 0.17% | 0.33% | 0.19% |
| 1969-1 | 0.44% | 0.42% | 0.73% | 2.12% | -2.07% | 1.64% |
| 1973-1 | 0.37% | 1.13% | 0.30% | -0.14% | -0.10% | 1.56% |
| 1977-1 | 0.10% | 0.06% | -0.50% | 0.20% | 0.14% | 0.00% |
| 1981-1 | 0.13% | -0.55% | -0.44% | 1.27% | 0.75% | 1.15% |
| 1985-1 | -0.03% | 0.01% | -0.57% | -0.79% | -0.29% | -1.68% |
| Avg | 0.20% | 0.21% | -0.09% | 0.53% | -0.32% | 0.53% |
| 1989-1 | 0.56% | -0.02% | 0.05% | -0.18% | 0.06% | 0.47% |
| 1993-1 | 0.86% | 0.25% | 0.57% | 0.20% | -0.22% | 1.67% |
| 1997-1 | 0.78% | -0.39% | -0.96% | -0.83% | -0.02% | -1.43% |
| 2001-1 | 1.19% | 2.87% | 0.88% | -2.48% | -5.34% | -2.88% |
| 2005-1 | 0.95% | -0.80% | -0.59% | -0.08% | -0.88% | -1.40% |
| Avg | 0.87% | 0.38% | -0.01% | -0.67% | -1.28% | -0.71% |
| OTC summary for Presidential Year 1 1965 - 2005 | ||||||
| Avg | 0.45% | 0.28% | -0.05% | -0.05% | -0.70% | -0.06% |
| Win% | 82% | 64% | 45% | 45% | 36% | 64% |
| OTC summary for all years 1963 - 2008 | ||||||
| Avg | 0.01% | 0.28% | -0.02% | 0.29% | -0.12% | 0.43% |
| Win% | 48% | 58% | 61% | 65% | 50% | 70% |
| SPX Presidential Year 1 | ||||||
| Year | Mon | Tue | Wed | Thur | Fri | Totals |
| 1953-1 | -0.04% | 0.31% | 0.81% | 0.04% | 0.19% | 1.31% |
| 1957-1 | 0.73% | 0.36% | 0.25% | -0.27% | -0.32% | 0.76% |
| 1961-1 | 0.16% | -0.91% | -0.05% | 0.09% | -0.03% | -0.73% |
| 1965-1 | 0.03% | -0.16% | -0.17% | 0.42% | 0.36% | 0.47% |
| 1969-1 | 0.34% | 0.33% | -0.27% | -0.67% | -0.40% | -0.66% |
| 1973-1 | 0.36% | 1.26% | 0.31% | -0.19% | -0.39% | 1.35% |
| 1977-1 | 0.05% | -0.38% | -0.76% | 0.57% | -0.02% | -0.54% |
| 1981-1 | 0.98% | -0.50% | -0.39% | 2.49% | -0.06% | 2.52% |
| 1985-1 | -0.64% | 0.09% | -0.87% | -0.63% | -0.23% | -2.27% |
| Avg | 0.22% | 0.16% | -0.40% | 0.31% | -0.22% | 0.08% |
| 1989-1 | 1.25% | -0.32% | 0.07% | -0.05% | -0.36% | 0.59% |
| 1993-1 | 1.93% | -0.07% | 0.42% | -0.57% | -0.86% | 0.86% |
| 1997-1 | 1.08% | -0.28% | -0.87% | -1.83% | 0.46% | -1.45% |
| 2001-1 | 0.59% | 1.00% | 0.65% | 0.23% | -2.48% | -0.02% |
| 2005-1 | 0.26% | -0.48% | -1.02% | 0.19% | -0.76% | -1.81% |
| Avg | 1.02% | -0.03% | -0.15% | -0.41% | -0.80% | -0.37% |
| SPX summary for Presidential Year 1 1953 - 2005 | ||||||
| Avg | 0.51% | 0.02% | -0.14% | -0.01% | -0.35% | 0.03% |
| Win% | 86% | 43% | 43% | 50% | 21% | 50% |
| SPX summary for all years 1953 - 2008 | ||||||
| Avg | -0.02% | 0.16% | 0.04% | 0.13% | -0.09% | 0.22% |
| Win% | 55% | 55% | 54% | 60% | 44% | 59% |
Conclusion
The market is as oversold as it has been at any time since June 1932. There have been three 20+% rallies since the early October low and another is long overdue, but, the extreme number of new lows suggest a retest so whatever we get will be a bear market rally.
I expect the major indices to be higher on Friday March 13 than they were on Friday March 6.
Last weeks positive forecast expecting a bounce from extremely oversold conditions was a miss.
Thank you,
By Mike Burk
To subscribe to this report : http://alphaim.net/signup.html
Gordon Harms produces a Power Point for our local timing group. You can get a copy of that at: http://www.stockmarket-ta.com/ .
Disclaimer: Mike Burk is an employee and principal of Alpha Investment Management (Alpha) a registered investment advisor. Charts and figures presented herein are believed to be reliable but we cannot attest to their accuracy. Recent (last 10-15 yrs.) data has been supplied by CSI (csidata.com), FastTrack (fasttrack.net), Quotes Plus (qp2.com) and the Wall Street Journal (wsj.com). Historical data is from Barron's and ISI price books. The views expressed are provided for information purposes only and should not be construed in any way as investment advice. Furthermore, the opinions expressed may change without notice.
Mike Burk Archive |
Stocks Overbought Entering Seasonally Weak Week
The good news is: New lows disappeared last week.
Short Term
Following the October 9, 2008 low:
The Russell 2000 (R2K) rose 14.4% in 2 days.
The NASDAQ composite (OTC) rose 12.1% in 2 days.
The S&P 500 (SPX) rose 11.6% in 2 days.
The Dow Jones Industrial Average rose 11.1% in 2 days.
Following the October 27, 2008 low:
The R2K rose 21.8% in 6 days.
The OTC rose 18.2% in 6 days.
The SPX rose 18.5% in 6 days.
The DJIA rose 17.7% in 6 days.
Following the November 20 low:
The R2K rose 22.8% in 6 days and hit a high January 6, 2009 up 33.6%.
The OTC rose 16.7% in 6 days and hit a high January 6, 2009 up 25.5%.
The SPX rose 19.1% in 6 days and hit a high January 6, 2009 up 24.2%.
The DJIA rose 16.9% in 6 days and hit a high January 6, 2009 up 19.4%.
In the 4 trading days since last Monday's low:
The R2K is up 14.5%.
The OTC us up 12.8%.
The SPX is up 11.8%.
The DJIA is up 10.3%.
So far, from a price perspective, this rally does not look much different from the others of the last 6 months.
Intermediate term
On the day prior to the October 27 OTC low there were 788 new lows on the NASDAQ. After 6 consecutive up days there were 53 new lows.
On the November 20 OTC low there were 1158 new lows on the NASDAQ. Five trading days later there were 29 new lows.
On Friday March 6 there were 567 new lows on the NASDAQ; last Friday there were 26.
The 567 new lows on March 6 suggests a high likelihood of a retest of last Monday's low, however this rally is likely to continue until new lows begin increasing.
The chart below covers the past 6 months showing the OTC in blue and a 10% trend (19 day EMA) of NASDAQ new lows (OTC NL) in black. OTC NL has been plotted on an inverted Y axis so decreasing new lows moves the indicator upward (up is good). Dashed vertical lines have been drawn on the 1st trading day of each month.
The indicator began moving sharply upward last week.
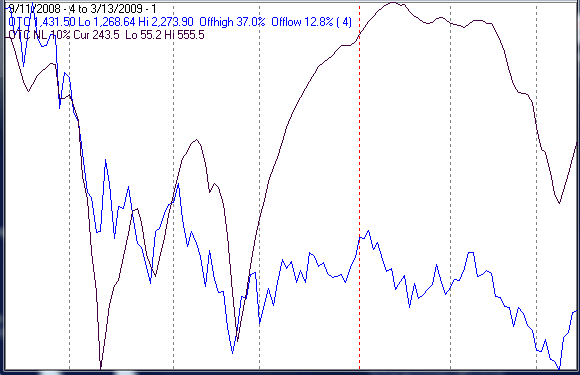
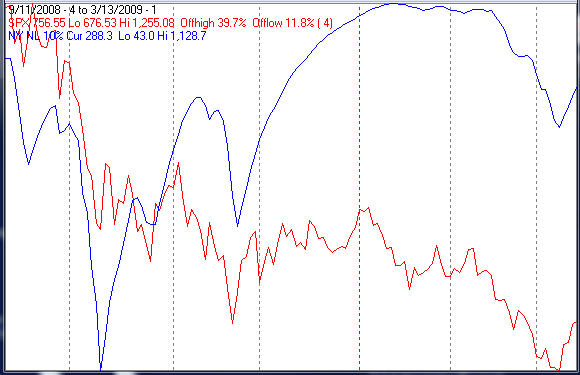
The chart below is similar to the one above except is shows the SPX in red and NY NL calculated from NYSE new lows in blue.
Seasonality
Next week includes the week prior to the 3rd Friday of March during the 1st year of the Presidential Cycle.
The tables show the daily return on a percentage basis for the week prior to the 3rd Friday of March during the 1st year of the Presidential Cycle. OTC data covers the period from 1963 - 2008 and SPX data from 1953 - 2008. There are summaries for both the 1st year of the Presidential Cycle and all years combined. Prior to 1953 the market traded 6 days a week so that data has been ignored.
During the 1st year of the Presidential Cycle, next week has had negative returns for over 20 years. The other years have not been much better.
Report for the week before the 3rd Friday of Mar
The number following the year is the position in the presidential cycle.
Daily returns from Monday through 3rd Friday.
| OTC Presidential Year 1 | ||||||
| Year | Mon | Tue | Wed | Thur | Fri | Totals |
| 1965-1 | 0.62% | 0.08% | 0.14% | 0.04% | -0.27% | 0.62% |
| 1969-1 | -0.44% | -0.22% | 0.01% | 0.47% | 0.60% | 0.43% |
| 1973-1 | -0.11% | 0.19% | 0.01% | 0.41% | -1.13% | -0.63% |
| 1977-1 | 0.12% | 0.21% | 0.20% | -0.17% | 0.02% | 0.39% |
| 1981-1 | 0.63% | -0.12% | 0.40% | 0.22% | 0.90% | 2.02% |
| 1985-1 | -0.41% | 0.08% | -1.14% | -0.27% | 0.18% | -1.56% |
| Avg | -0.04% | 0.03% | -0.11% | 0.13% | 0.12% | 0.13% |
| 1989-1 | 0.16% | -0.14% | 0.24% | 0.62% | -1.79% | -0.90% |
| 1993-1 | 0.35% | 0.04% | -1.16% | 0.00% | -0.68% | -1.45% |
| 1997-1 | -1.05% | -0.75% | -1.60% | 0.78% | -0.41% | -3.03% |
| 2001-1 | -6.30% | 4.75% | -2.12% | -1.59% | -2.57% | -7.83% |
| 2005-1 | 0.46% | -0.78% | -0.94% | 0.03% | -0.43% | -1.66% |
| Avg | -1.28% | 0.62% | -1.12% | -0.03% | -1.18% | -2.97% |
| OTC summary for Presidential Year 1 1965 - 2005 | ||||||
| Avg | -0.54% | 0.30% | -0.54% | 0.05% | -0.51% | -1.24% |
| Win% | 55% | 55% | 55% | 73% | 36% | 36% |
| OTC summary for all years 1963 - 2008 | ||||||
| Avg | -0.15% | -0.03% | -0.01% | 0.17% | -0.06% | -0.09% |
| Win% | 52% | 54% | 63% | 72% | 52% | 54% |
| SPX Presidential Year 1 | ||||||
| Year | Mon | Tue | Wed | Thur | Fri | Totals |
| 1953-1 | 0.15% | 0.42% | -0.34% | -0.08% | -0.15% | 0.00% |
| 1957-1 | -0.66% | -0.07% | 0.66% | 0.07% | -0.05% | -0.04% |
| 1961-1 | 0.28% | -0.44% | 0.30% | 1.01% | 0.61% | 1.76% |
| 1965-1 | 0.03% | -0.13% | -0.13% | -0.24% | 0.03% | -0.42% |
| 1969-1 | 0.26% | 0.24% | 0.73% | 0.64% | -0.21% | 1.66% |
| 1973-1 | 0.06% | 0.54% | 0.44% | -0.75% | -0.51% | -0.21% |
| 1977-1 | 0.77% | 0.55% | 0.19% | -0.09% | -0.22% | 1.20% |
| 1981-1 | 1.18% | -0.56% | 0.22% | -0.57% | 0.46% | 0.74% |
| 1985-1 | -0.17% | 0.49% | -0.82% | -0.20% | ||
© 2005-2022 http://www.MarketOracle.co.uk - The Market Oracle is a FREE Daily Financial Markets Analysis & Forecasting online publication.


