Gold Mid-Year Seasonal Trend Review July 2009
Commodities / Gold & Silver 2009 Jul 15, 2009 - 12:33 PM GMTBy: Bill_Downey
 During the course of the year, it is always good to sit back and review the current markets you’re involved in. In this manner, one would look at the performance not only from a percentage gain or loss basis, but in the field of seasonality as well. In other words, if we are interested in the gold market, we want to see if it is following the typical script in price movement in relation to past years. Keeping an eye on seasonality will alert you to when the best chance for highs and lows to occur during the year.
More important of an indicator that something might be going on is when a commodity does not perform like it usually does during its yearly cycle. Movement that is uncommon can provide for opportunity in the form of rallies and/or corrections (uptrend’s and downtrends.) When we see a commodity rally when it’s seasonally weak, we can ascertain potential underlying strength that has not yet been discounted by the market. The same can be said if a commodity is weak during a time when it should be strong. Keeping an eye on this gives one a good perspective of whether the market is strong, weak, or normal.
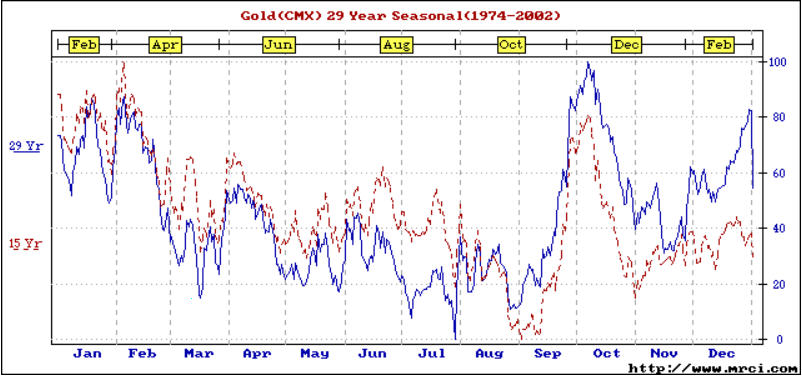
How has gold been performing so far this year, and over the past year? Well so far this year, gold peaked in February, went lower into April, rallied in May and into the first week of June, and our largest correction year to date has brought us to the July timeframe. As you can see in the seasonal chart below, gold is following the exact script it usually does in an average year. Therefore, we can categorize gold as in a NORMAL trending fashion thus far this year.

Now obviously the seasonal chart is the “average” and is not going to be the “exact” play that will unfold. It does however give us the perspective of what we should be expecting.
July and August is when gold usually makes its lows for the year. But that is in a normal year. Here are a few examples of what I mean.
When gold is strong, while there is usually a winter peak, the rallies back up from the spring make new highs above the winter peaks. In such instances, gold can make a good pullback and sometimes the low for the year comes during the October and even November time frame. This is also the case when gold goes through a weak summer season. Regardless, the important point is that there are usually two optimum times during the year to buy gold. And that is the July/August and the October/November timeframe.
There is one more aspect to discuss and that is the massacre of last summer in the mining stocks, silver, and to some extent, gold. The break in the market came at around July 25th of last year. At least that was when the “trend” accelerated to the downside in collapse fashion. Take particular note that September in the metals usually is the strongest momentum uptrend for the entire year. Last years clue that something was terribly wrong was the inability of gold to sustain price support and kept making new lows. This was occurring when the metal should have been its strongest. The rest is legendary as the collapse took the mining shares down 70% before they bottomed. And due to its weakness, the metals bottomed in the October/November timeframe, very late in the seasonal trend.
2nd half outlook for gold
Should this continue to be a normal year, expect the July/August and the October/November timeframes to be the two buying points for the year for gold and silver bulls. Now that we know the two time zones let’s look at price and see what guidance it may provide in order to establish whether gold is strong, weak, or normal.

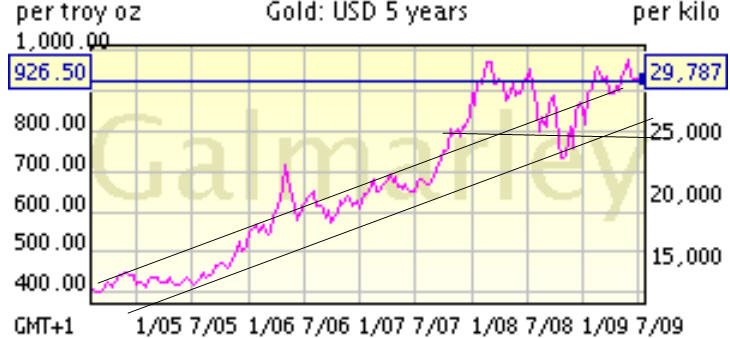
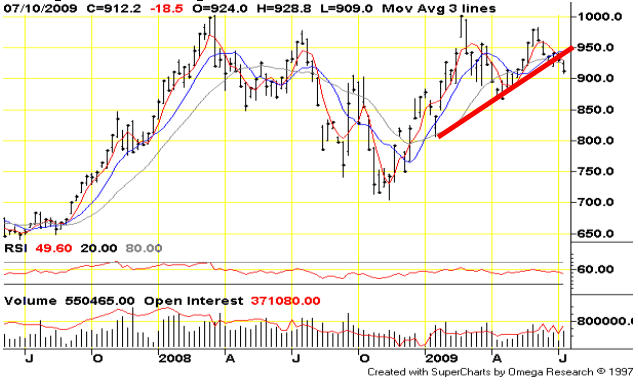
The chart above is a monthly close chart. I choose it to emphasize that the highest monthly closing ever in gold has NEVER BEEN ABOVE 940. Write that down on a piece of paper, stick it on your desk, your computer, your forehead if you have to but make sure you keep that in mind. And the reason is simple. ANYTIME we are above the 940 area in gold, the chances of “EXPLODING” to the upside and/or a new rally leg beginning is greatly enhanced. But there’s an even more important price to be on the watch for.
Notice the two parallel channel lines from 2005. The top of that channel line in the month of July is approximately situated at the 905-912 area in gold. THIS IS THE EXACT AREA WE CURRENTLY TRADED AT MONDAY morning. Since the first bounce has occurred in price we’ve moved to the 928 area as of Tuesday July 14. For the super bull in the crowd, this is an excellent spot to put a position on if he/she believes we are on the verge of a breakout at anytime. Stops are suggested should the strategy be incorrect below 880-899 as part of a risk management tactic.
Now I am not suggesting that the exact low will rest on the channel line. After all, it is a monthly close line. However, we can make these two observations based on this channel line. ANYTIME we are below 899 in gold, a yellow warning flag is being waved. That yellow flag says that gold, should it re-enter the 2005 channel will have downside parameters (a potential) of 790-840 in spot gold. Therefore, as long as we CLOSE above 899 on any last trading day of the month, the intermediate and long term momentum will remain in an uptrend. We should expect the lows of the summer to be soon, July/August if that is the case. We should expect a good rally during September, and a pullback in the October and/or November time frame. From there, we should expect a rally into the winter months setting new all time highs in 2010. This is all predicated that gold is going to hold above the LOWS already established in 2009. What if we go lower than we have for this year during the summer?
That is a valid consideration and a most important one.
Since the 899 channel close is only valid on the last day of the month, I know that waiting for a sell signal a whole month is not the type of risk one can afford these days. Therefore, let’s take a closer look at what to be on guard for over the summer and where other potential price targets take place.
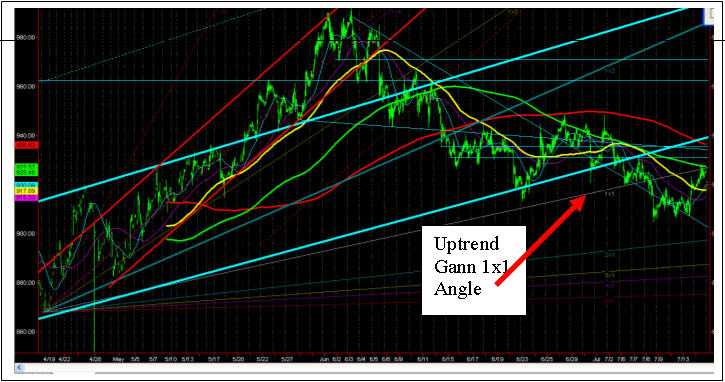
First we’ll define the uptrend with the Gann 1 x 1 uptrend line (see red arrow). This simply means technically, anytime we are above the 1 x 1 line, the gold market is in an uptrend from the April lows of 2009. As you can barely see on the chart below, that line is just above the 928 area in August gold, and is rising at a very modest rate. So, anytime we are above the line, we can say we are in an uptrend from the spring lows. Anytime we are below that line, at best the trend is neutral.
It is important that gold moves above that line in order to establish an uptrend again.

How about the downtrend from the June peak? How shall we quantify that technical condition? Looking at the chart again, we can see that the slow (Red line) moving average, has contained all the bounces in gold since the downtrend began. Look at those peaks near the end of June. All three were contained by that red moving average.
Of particular interest is the fact that the spring uptrend channel (fat bottom aqua line) is situated at about the same price as the slow (red) moving average. Observe how they are intersecting at the 938 to 940 price area. It is just a coincidence that the highest ever monthly closing in the gold market that I discussed at the beginning of this article is at this EXACT SAME LOCATION IN PRICE? Whether it is or it isn’t, this is a terrific PIVOT POINT (940-944 price)for which way this market is going to go and a great tactical location for traders and investors to ascertain whether we are in an uptrend or whether we are moving sideways to lower. In other words, if we had to pick a spot for where the uptrend and downtrend meet, the 940-944 area is a KEY one.
We can conclude that in the short term, when gold is above the 1x1 Gann Angle and more importantly above the blue channel bottoms aqua trend line, that gold is in an uptrend. This means anytime we are above the 940-944 area in July, we can define that we are up trending.
Let’s also discuss the downside. Notice how gold made a TRIPLE low on Monday and Tuesday of this week at around the 907 area? If you look hard, you can see a faint blue trend line that is drawn from the price peaks of June. See how the last bottom was right on this trend line during the Tuesday morning session? The question now becomes, is this LOWS FOR THE SUMMER? As of right now, we can only qualify this as a bounce. However, the transition point is the 928 to 940 area. This is where we transition from bounce to potential rally. Should we begin to supporting above the bottom of the blue channel line and subsequently move above the 949-954 area, then the potential to challenge the highs of this winter at a minimum will be in play in July.
Now before we get too worked up, what is the most likely thing that gold will do in the next few months?
Let’s say gold continues to remain “normal”. Then odds suggest this is just a mid month bounce that price should peak in the 950-970 area and another pullback should develop towards the end of July or the August timeframe. That pullback would most likely pierce the lows established here and provide the flush out before the fall rally. The lows would most likely be in the 790-850 area.
What if gold is strong? Well, let’s ask the question, is gold strong? What is the evidence? First, it has been almost 18 months since gold has made a new high. Does that seem strong? Well the fact that it keeps on hovering just below 1000 does seem to indicate that while there is someone selling at the 990-1040 area, for now, there is also a strong underlying support for gold at or just below the 900 area.
I guess one would ask who in the world would be selling gold at the 1000 area? Now, if this were a normal free market, the answer would be easy. It would be THE SUPPLIERS of the commodity. However, we are living in extraordinary times.
One of the guys I chit chat with turned me on to a very interesting research paper the other day. Buried deep within the rules of the COMEX and the TOPIX (Japanese Market) are delivery specifications that have been modified for gold. As incredible as it may seem, the rules now allow the EXCHANGE to use ETF’s as contract settlements via the purchase of the GLD and AU gold etf’s that are available. In other words, THEY HAVE FIGURED OUT HOW TO SUPPLY PAPER GOLD to the exchanges. Here is the link if you want to verify it. http://www.gata.org/node/7586
Therefore the distinct possibility exists that the markets have been “Jimmied.” Or maybe we should call it “Timmied.” Regardless, the link shows how the COMEX can settle up with paper gold. Is the PPT (Plunge Protection Team) capping gold at the $1000 level?
A review of the COT (commitment of traders) reports shows that only a handful of shorts exist. This in itself goes a long way to explaining why gold is acting so strange by not moving above to new highs.

The longer markets are manipulated the greater the force is going to be when the “adjustment” comes. We have seen extraordinary events. It’s obvious we have more to see. In the chart above, the most likely low (from a symmetrical standpoint) would be a low this summer near the 840-860 area. The chart above shows how gold is trying to hold the 900 area too. One final note……….is the observation that on the weekly chart above, there is not much SUPPORT UNDER THE 830 area until 650-700. Therefore, anytime we are below 830 we should be on guard.
Conclusions: The stronger gold is, the sooner it will bottom and begin its seasonal rally. Should gold remain in normal mode as it has been, look for sideways action in the 800-1040 level this summer. Ideal time for a low would be late August or early September.
Anytime that gold is above the 950-970 area, the rally can ignite at any time.
On the downside anytime we are below the 880-900 area in gold, we cannot exclude the fact that another “cascade” down in all markets could develop one more time. I think this is the only possible scenario in which gold would be vulnerable to a market decline.
Key Price points to remember:
- On a monthly basis, as long as gold remains above 850-880, the trend is still up and solid. Below the 900 level and the chances for a pullbacks lower than 850 cannot be dismissed.
- On a weekly basis, anytime we are above the 940-970 area, the likelihood of a new major up leg increases significantly. Anytime we are below the 880 area, the chances for a correction increase significantly.
- On a daily basis, as long as we are above 944, the odds favor the upside. Anytime we are below the 892-899 area, the chance for a correction increase significantly.
Gold’s fundamentals have never been better. The question we ask ……is the price of gold being contained cannot be dismissed nor can the potential of another leg down due to the cascading effect spoken about earlier. Beyond that, odds look good for gold. No one knows price for certainty. From a price perspective, ONLY A TRUE MOVE above 1075 will confirm that the long term bull market has resumed. Virtually every analyst is keyed in on the ABOVE 1000 area. Point being that there must be one heck of a lot of buy stops to go long, cover shorts, etc etc above 1000. Someone is doing all it can to hold prices, or this quadruple top is one of the rarest price patterns in quite a while. While we are below 1000, as small as the chance of a big correction may be, it must be worked into the equation.
With that said, the outlook for Gold, ONCE IT CLEARS overhead resistance above 1000, things look good for gold. If it is to happen this year chances are it will be in the August or maybe October timeframe. Should there be a flush out on the down side, look at some of the price areas listed in this report. It will make for a great buying opportunity. Should we remain locked in a tight 120 dollar range between 880 and 1000 this summer……………there should be a strong rally that begins in late August early September. Anytime we are below 900, a yellow caution flag will be up. Anytime we are above the 950-970 area, the potential for gold to rally will be significant in the coming months of this year. Look for price lows this summer and a pullback this fall. Should support and resistance numbers come into play along with these time targets, it should provide an optimum time to add to positions or get on board. One last note. As long as we remain below 1000-1075 the potential for the gold crowd to be wrong will still exist……..no matter how small that chance may be. So until then, remain cautious and alert and look for clues along the way.
If you would like to receive Free Gold Analysis please visit my site: www.TechnicalCommodityTrader.com
May you all prosper.
William – “The Lone Trader”
http://www.technicalcommoditytrader.com
© Copyright Bill Downey 2009
Disclaimer: The above is a matter of opinion provided for general information purposes only and is not intended as investment advice. Information and analysis above are derived from sources and utilising methods believed to be reliable, but we cannot accept responsibility for any losses you may incur as a result of this analysis. Individuals should consult with their personal financial advisors.
© 2005-2022 http://www.MarketOracle.co.uk - The Market Oracle is a FREE Daily Financial Markets Analysis & Forecasting online publication.


