A little Stock and Gold Market Dip Do ya, Plus a Look at the Week Ahead
Stock-Markets / US Stock Markets Jun 09, 2007 - 03:40 PM GMTBy: Joseph_Russo
 A week ago, we alerted readers of an imminent June Swoon . We opened last week's commentary by stating: “After 11-weeks of nothing but blue-sky, we suspect this bull may be growing bored of the dominance it imposes upon bears at will. Perhaps a couple of weeks respite in June ought to be a minimum at which this easily antagonized bull may once again become angered, electing to resume its deceptive charge with renewed fury.”
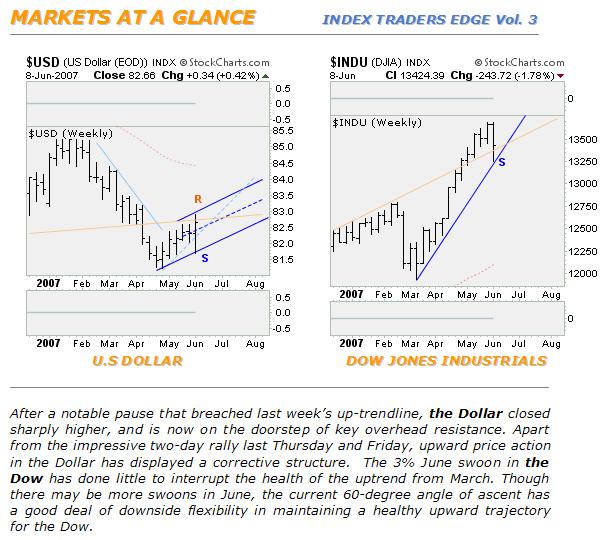
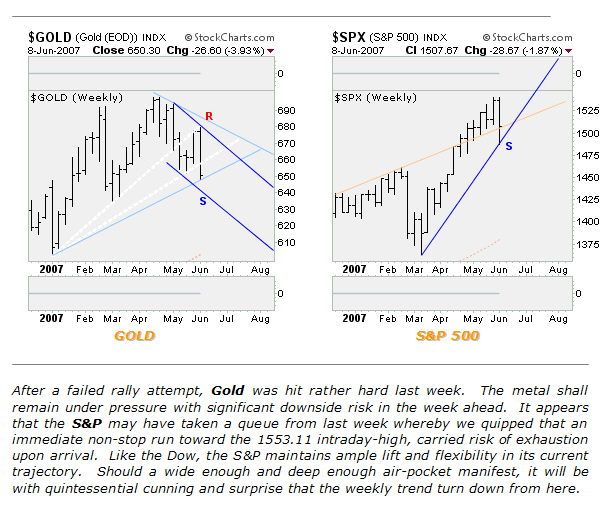
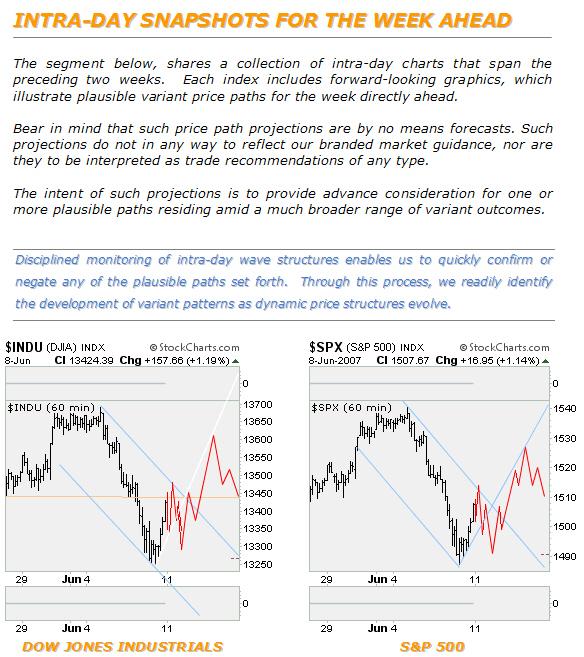
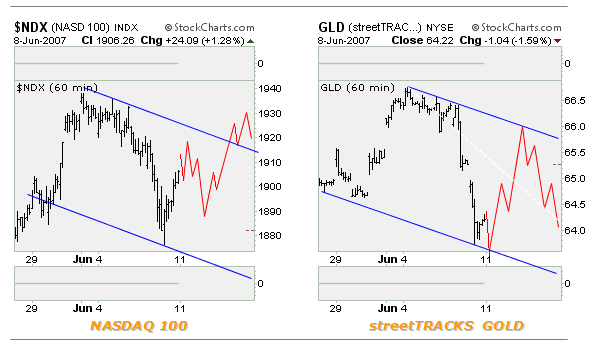
Timing last weeks sell-off was business as usual for us, and nothing short of perfect. For the first trading week in June, the majority of broad based financial indices (save for the US Dollar) took sizeable losses. By last Thursday's close, the Dow Jones Industrials gave back 425-points - or 3.10% from its recent print highs.
Next, we will look at how the major indices faired last week, and what may be in store ahead.
Trade Triggers and Target Captures From Elliott Wave Technology's Near Term Outlook for the week ending June 8, 2007
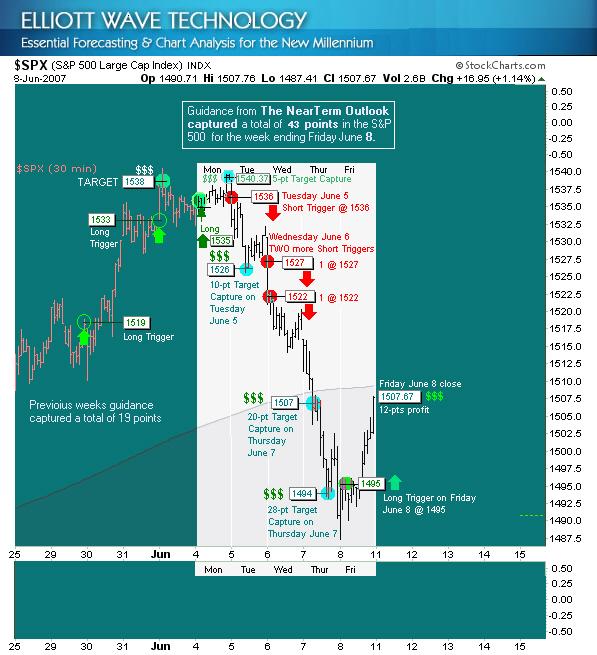
The price data, trade-triggers, and capture-targets in the gray center panel of the chart below, represent the culmination of analysis presented over the last week of trade. Price data in the left panel shows guidance for the week prior to last. The panel on the right is empty awaiting next weeks price data. However, we have already populated the Near Term Outlook for Monday with an array of trade-triggers, and price-targets for next week. Do join us should you wish to fine-tune or establish fresh trading points toward gaining a clear competitive edge for the week ahead and beyond.
From two-weeks ago - for the week ending June-1
Our short-term analysis began last week after outlining triggers and targets, which had amassed nearly 20-pts in profit from the S&P the week prior.
Monday, June 4 – Friday, June 8
After reaching an upside price target of 1538 from the prior week, we tagged last weeks first short-term capture with a small 5-point upside target from the 1535 level. Apart from that, Monday's trade was mostly a non-event retest failure-session.
The next three days knocked the bullish wind out of most all broad based indices. By Friday, bullish blowback was all over the bears with vengeance.
We have annotated the above chart highlighting the balance of the week's price-points and targets. We have noted resting sell-triggers with red circle points, target-captures in turquoise, and buy-triggers in green.
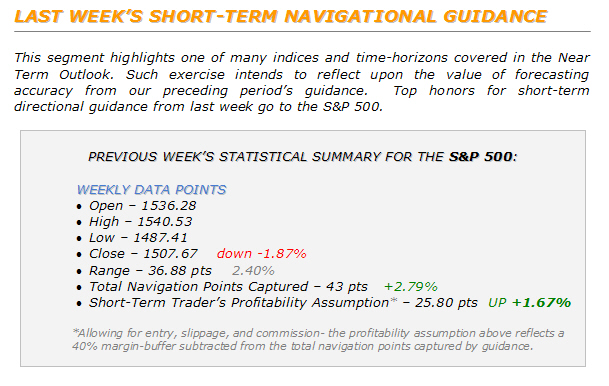
By weeks-end, our analysis had pinpointed over 40-pts worth of profitable trade set-ups in the S&P 500. Including the 19-pts captured the week prior, we have successfully identified over 60 S&P profit points in the past two weeks!
Our discipline in maintaining high levels of impartiality relative to bias - brings forth a constant flow of short-term trade set-ups on both sides of the market.
Given this robust two-way dynamism, a fair number of triggers will fail to meet their targets. Because offsetting triggers often reside within tolerable risk levels above and below the market, potential losses related to directional target failure are limited.
Does all this sound too good to be true? The short answer is YES, it does indeed!
Let's get real for a minute. Truth told - it is highly unlikely that anyone on the face of the Earth could have possibly executed entry and exit orders to capture 100% the price points we provided last week. Given this reality, we automatically deduct 40% from the total point-capture in arriving at a more realistic profit assumption from our ongoing analysis.
Does it still sound too good to be true? Frankly, it does – and the answer is still YES!
Even after the 40% margin buffer – a respectable level of talent is still required in one translating our directional guidance into working orders, and booked profits.
As it is, order execution and trade management skills are challenging enough - both require a good deal of practice, patience, and discipline to acquire. Obtaining a reliable road map of price-targets, and trade-triggers from which to evaluate, launch, and manage trades, is of very actionable utility while honing such skills.
Although having an accurate market-map cannot guarantee one will never make wrong turns, access to such content can only improve the bottom line and skill set for every level of trader imaginable – without a doubt!
The Near Term Outlook delivers unrivaled short and long-term forecasting guidance for the U.S Dollar, Dow, SPX, Gold, HUI, and NDX.
The concise, impartial market guidance, present throughout our publication, provides clear targets, triggers, and variant parameters from which active traders can successfully evaluate, and construct low-risk trading strategies. The long-term rewards in adopting such guidance as part of one's trading arsenal are quite substantial, and well worth the marginal investment premium.
The rigors and discipline we employ in developing forward guidance are void of mysticism, idle chatter, and all other varying forms of market-magic formulas. Our methodology is fully transparent, and clearly translated, providing a lifelong benefit of advanced trading skills to each of our clients.
Trade Better / Invest Smarter...
By Joseph Russo
Chief Editor and Technical Analyst
Elliott Wave Technology
Copyright © 2007 Elliott Wave Technology. All Rights Reserved.
Joseph Russo, presently the Publisher and Chief Market analyst for Elliott Wave Technology, has been studying Elliott Wave Theory, and the Technical Analysis of Financial Markets since 1991 and currently maintains active member status in the "Market Technicians Association." Joe continues to expand his body of knowledge through the MTA's accredited CMT program.
© 2005-2022 http://www.MarketOracle.co.uk - The Market Oracle is a FREE Daily Financial Markets Analysis & Forecasting online publication.


