Stocks & Commodity Markets Analysis - Don't Say the Crash Word (Yet)
Stock-Markets / Financial Markets Jun 10, 2007 - 09:50 PM GMTBy: Dominick
 Finally, a double top! Or, wait, was it just a pullback in an uptrend?
The volatility we promised back in January has been a constant theme this year, and the market continues to punish anyone that is wrong or just has some of that good ol’ bias. “Crash”, the C-word, was once again splattered across the topic lines of many forums and financial groups. You would think after what we went through this year at the March bottom, and last year in June, people would learn to at least give it more than a week before labeling the move.
Most know that my thought has been that this market won’t stop moving up until it takes out every last bear. The chart below of the ISEE proved that the option player was buying puts on Thursday with both hands. It was posted in the chatroom on Thursday’s decline showing that we were spiking to levels not since the March lows. The market is made of fear and greed and boy were they both flying this week!
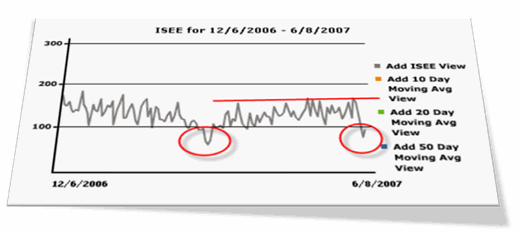
So, could we have bottomed in a 4th wave or be bottoming in something of larger degree? Fourth waves are characterized by "surprising disappointment" and often terminate near the previous fourth wave of lesser degree or the second wave of an extended fifth in the preceding upleg. This week's drop qualifies on all counts. We originally had been looking for a pullback into the 1485 area since the character of the preceding advance suggested a deep fourth wave decline and that's what we got. Judging by put/call action and the ISEE chart above, the drop was enough to convince most that they should now play the market from the short side. We were starting to become frustrated about not getting the pullback for weeks only to realize that it used our exact June 1st turn date to start the decline. Not only the exact date, but also right into a perfect target. Readers will remember this chart below that we used to trade into the target area last week.
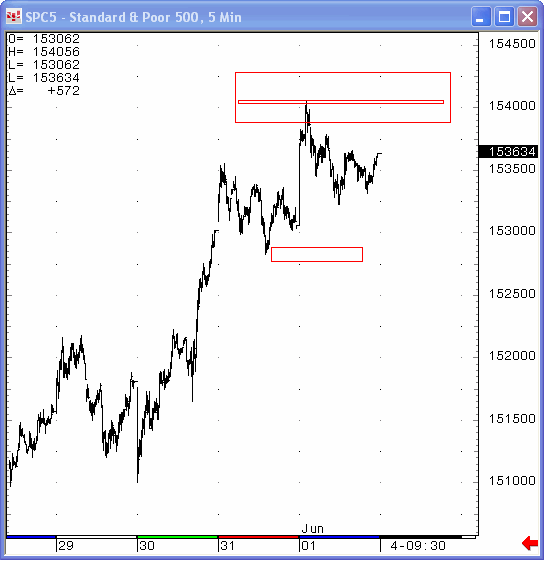
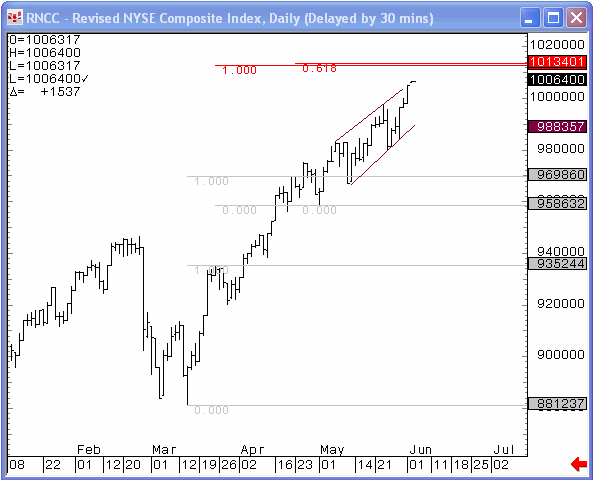
Thursday night, May 31st, I had shared my concern over the market and, to sum up a lengthy post, I basically said that the risk had shifted to the long side. Until then, I had believed it was to the short side which proved to be correct. Sure enough, Friday morning the S&P’s make a high, then a double top on Monday, before they began the recent selloff. Basically our target of 1539.60/1545 was achieved at the exact turn date of June 1st. Below is one of the charts that were supporting a reason for a high. It’s a chart of the New York Stock Exchange showing an ending diagonal aiming for its target.
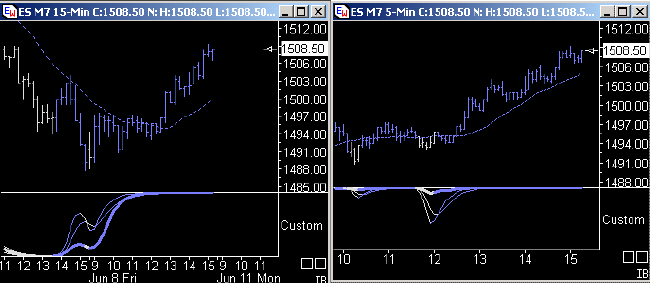
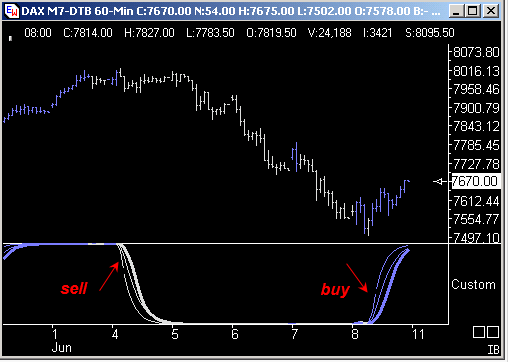
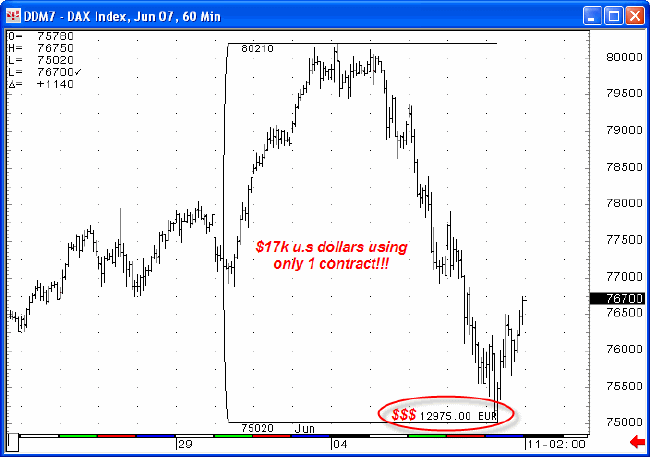
In the meantime, our members have several choices of what to use to help them become better traders. The proprietary trend charts have been a powerful tool, and one I’ve kept an eye on recently as they signaled to sell the top of the market last week just like they did in the Dax. The two charts below gave us approval for our bullish idea Friday morning to go in and BUY! Once seeing the setup in these trend charts, we knew it was ok to go long a scared market. We now have end of day trend chart now on over 20 markets. That alone is worth the price of admission. $50, 1 ES point!!
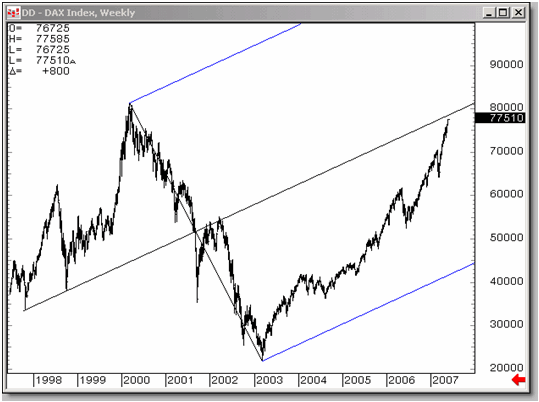
Readers should remember this target we had a few weeks ago in a screaming market, the Dax. The chart below shows one of the reasons why we thought we were reaching price resistance. A simple Andrews’s fork that has been in place for 10 years pointed us to a target at its midline.
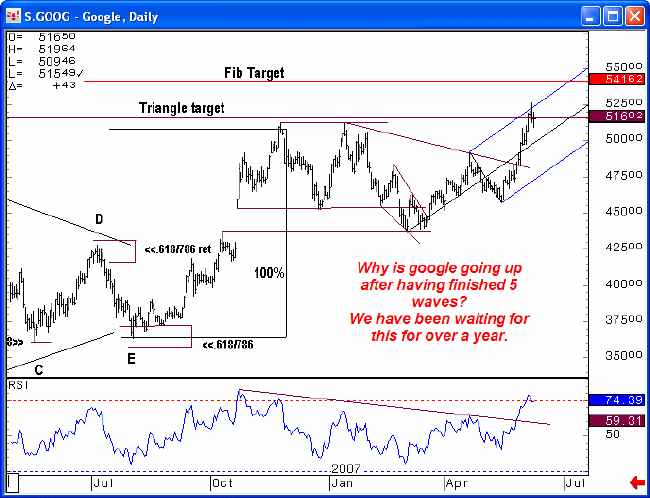
Readers should remember me following Google as it was in a triangle and then the play-by-play as it went to a perfect triangle measurement. Once there, I stated that I had a nice target above, but had no reason to reach for it as there was a perfect completion of its Elliott requirements. I also said that I was curious to see if it would make the attempt at a later date to reach for this target that many will never be able to find. Well, here we are going for it at a time where the markets were screaming to the downside. I will be patiently waiting to see what happens if it does try to extend up a bit in the coming days or weeks.
After achieving the first half of Joe’s confirmation signal, a weekly close above the 5-day moving average, gold finally gave up that level Friday morning and ultimately failed to make the needed two in a row. The charts here are getting ugly, but the metals at least got some relief along with stocks at the end of the day Friday and have not yet broken important support just below current levels. Be sure to read Joe’s “Precious Points” update for more on the week that was and what’s next from here.
*To Current and Prospective Members:
TTC will be increasing its monthly subscription fee on July 1st. The increase has become inevitable due to our ongoing expansion of the Website, computer and software upgrades, and the addition of services such as trend cycle charts. Current members and anyone that joins before the increase takes effect will not be subject to the new price, and will continue paying the current $50 subscription fee on a month-to-month basis. So, if you have been thinking of joining, this is a great time.
Thank you for your attention to these changes. If there are any questions, please direct your email to admin@tradingthecharts.com.
Have a profitable and safe week trading, and remember:
“Unbiased Elliott Wave works!”
By Dominick
For real-time analysis, become a member for only $50
If you've enjoyed this article, signup for Market Updates , our monthly newsletter, and, for more immediate analysis and market reaction, view my work and the charts exchanged between our seasoned traders in TradingtheCharts forum . Continued success has inspired expansion of the “open access to non subscribers” forums, and our Market Advisory members and I have agreed to post our work in these forums periodically. Explore services from Wall Street's best, including Jim Curry, Tim Ords, Glen Neely, Richard Rhodes, Andre Gratian, Bob Carver, Eric Hadik, Chartsedge, Elliott today, Stock Barometer, Harry Boxer, Mike Paulenoff and others. Try them all, subscribe to the ones that suit your style, and accelerate your trading profits! These forums are on the top of the homepage at Trading the Charts. Market analysts are always welcome to contribute to the Forum or newsletter. Email me @ Dominick@tradingthecharts.com if you have any interest.
This update is provided as general information and is not an investment recommendation. TTC accepts no liability whatsoever for any losses resulting from action taken based on the contents of its charts, commentaries, or price data. Securities and commodities markets involve inherent risk and not all positions are suitable for each individual. Check with your licensed financial advisor or broker prior to taking any action.
© 2005-2022 http://www.MarketOracle.co.uk - The Market Oracle is a FREE Daily Financial Markets Analysis & Forecasting online publication.


