U.S. Dollar Dying, Gold Gleaming
Commodities / Gold & Silver 2009 Jul 28, 2009 - 06:45 AM GMT Larry Edelson and Richard Mogey write: Although sharp rallies are always possible, we have no doubt the greenback’s long-term future is grim.
Washington’s $2 trillion deficits, record-shattering borrowing by the U.S. Treasury and seemingly endless money-printing at the Fed make a decline in the value of the greenback a virtual certainty.
In our view, the only question that remains is the timing: WHEN will the dollar decline begin?
 |
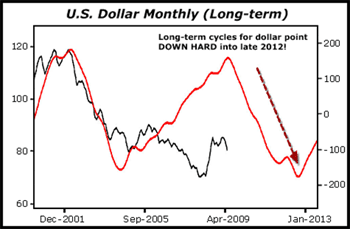
To get an answer, take a look at the historical cycle in the U.S. dollar to the right. Note how closely the actual value of the dollar (the black line) has followed its historical cycle based on data going all the way back to 1912 (the red line).
This is based on the data from our Foundation for the Study of Cycles. And our cyclical analysis has called virtually every major trend in the greenback, including the peak in 2001, the short-term bottom in 2004, the record low in 2008, and the recent bounce.
And now, it’s calling for a low in the dollar coming in 2012.
No wonder India and France recently joined with Russia and China calling for the dollar to be replaced as the world’s reserve currency! And now there are even rumblings coming out of Japan that it, too, is looking to diversify its dollar reserves — at $685.9 billion, the second largest in the world — away from the dollar.
Cyclical Gold Profits Ahead
 |
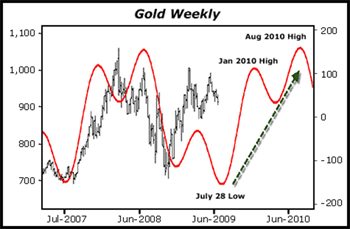
As you might expect, the pattern in gold is the opposite. Our cyclical research for the yellow metal shows that we are just now entering what promises to be a wildly profitable run for gold investors.
On this chart, you can see that the cyclical forces are projecting that gold could bottom as soon as the end of THIS month.
And longer-term, it shows gold’s bull market remains very much intact. As you can see from this chart, gold is set to resume its bull move, which should see it rally strongly into early January of next year, then dip into the spring of 2010, and then rally strongly again into August 2010. That’s when we suspect we may see gold reach as much as $1,500 per ounce.

While our cyclical analysis is forecasting a stellar bull market for gold, cycles research on individual gold investments is equally compelling.
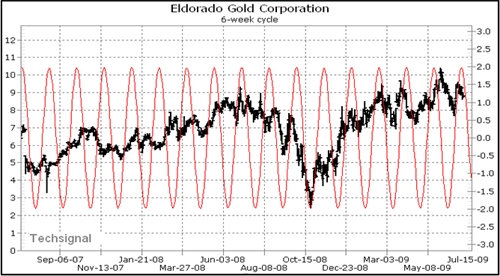
Take Eldorado Gold, for instance: As you can see from the chart, its cycle is also reaching its “buy” phase right now.
 |
Looking back, if you had bought at every previous cycle low using a 2% closing stop and sold at every previous peak in that cycle, you would have had 30 winning trades and 21 small losers.
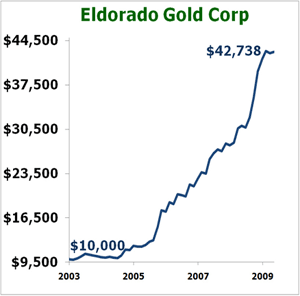
More importantly, an initial $10,000 investment in 2003 would be worth $42,738 today. You would have quadrupled your money.
This barely scratches the surface of the opportunities we have seen and continue to see. So we suggest you delve into this more deeply: For our full report on how you can use cyclical analysis to go for major profits, just click this link.
Best wishes,
Richard and Larry Editors, The Foundation Alliance
This investment news is brought to you by Money and Markets . Money and Markets is a free daily investment newsletter from Martin D. Weiss and Weiss Research analysts offering the latest investing news and financial insights for the stock market, including tips and advice on investing in gold, energy and oil. Dr. Weiss is a leader in the fields of investing, interest rates, financial safety and economic forecasting. To view archives or subscribe, visit http://www.moneyandmarkets.com .
Money and Markets Archive |
© 2005-2022 http://www.MarketOracle.co.uk - The Market Oracle is a FREE Daily Financial Markets Analysis & Forecasting online publication.


