


Weekly Unemployment Claims Portend Disaster
Economics / Recession 2008 - 2010 Aug 01, 2009 - 03:41 PM GMTBy: Mike_Shedlock

 The Department of Labor Weekly Unemployment Report is now so skewed by abnormalities, it is difficult to get a clear picture. First, let's take a look at the data.
Seasonally Adjusted Data
In the week ending July 25, the advance figure for seasonally adjusted initial claims was 584,000, an increase of 25,000 from the previous week's revised figure of 559,000. The 4-week moving average was 559,000, a decrease of 8,250 from the previous week's revised average of 567,250.
The advance seasonally adjusted insured unemployment rate was 4.7 percent for the week ending July 18, unchanged from the prior week's unrevised rate of 4.7 percent.
The advance number for seasonally adjusted insured unemployment during the week ending July 18 was 6,197,000, a decrease of 54,000 from the preceding week's revised level of 6,251,000. The 4-week moving average was 6,416,250, a decrease of 131,750 from the preceding week's revised average of 6,548,000.
Weekly Claims

Initial Claims Analysis
One could point at the substantial +25,000 jump in initial claims and conclude things are deteriorating. However, it is difficult if not impossible to know exactly because a huge seasonal adjustment factor beyond the ordinary related to auto manufacturing plant shutdowns skewed the seasonally adjusted numbers.
The unadjusted drop of -78,111 is even more misleading. Moreover, the only way to use unadjusted numbers accurately is on a year-over-year basis and that fails for reasons stated.
Continuing Claims Analysis
Note the huge drop of 131,750 in continuing claims. Ordinarily this might be significant. However, these are not ordinary times. Much, perhaps all of that drop is due to benefits expiring.
Indeed states and federal programs have extended unemployment benefits several times. They do so but do not adjust the headline numbers.
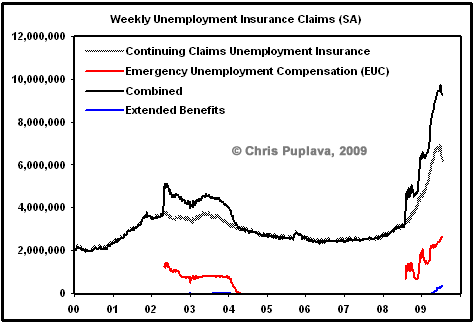
Please look at lines boxed in red for Extended Benefits and EUC 2008. The latter is Federal extensions picking up where states left off. The former is state extended benefit programs.
Note that 2,656,879 people are on extended federal benefits compared to 127,438 a year ago!
In other words, the headline extended claims number of 6,416,250 is off by more than 2.6 million. And one also needs to add in another 352,000 from various state programs.
Still More Considerations
Even though EUC 2008 claims rose by 24,518, one cannot count on that number either because hundreds of thousands have used up all of their extended benefits.
On July 19, I noted 500,000 Will Exhaust Unemployment Benefits by September, 1.5 Million by Year-end.
Unemployment benefits plus extension last 79 weeks in New York, over 1.5 years. Yet, in June alone, for New York alone, 47,000 used up 72 of those weeks, and count on the extra 7.
From the above post, courtesy of Dave Rosenberg:
Record Number See Benefits End
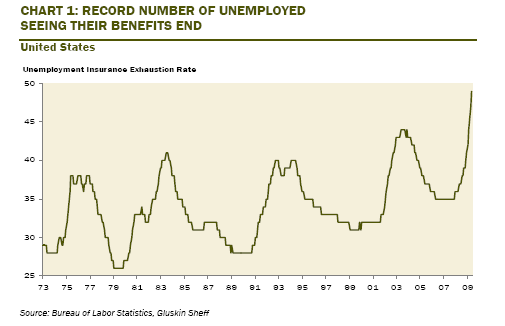
Take a good look at that chart. It's 50,000 now. The expectation is 500,000 by September and 1.5 million by the end of the year. What are the odds Obama creates 1.5 million jobs by the end of the year? Can he really create any? For how long?
Emergency Unemployment Compensation
Inquiring minds may wish to consider the Emergency Unemployment Compensation (EUC) PDF.
EUC is a federal emergency extension that can provide up to 33 additional weeks of unemployment benefits. The first payable week was the week of July 6-12, 2008.
The original extension passed in July 2008 paid up to 13 weeks of additional benefits. Effective November 23, 2008, we can pay up to 7 additional weeks of benefits.
Effective December 7, 2008, we can pay up to another 13 weeks of benefits.With that backdrop, here are some custom created charts courtesy of Chris Puplava at Financial Sense, based on my request. The charts show the effect of the EUC program over time.
Continuing Claims Since 2000
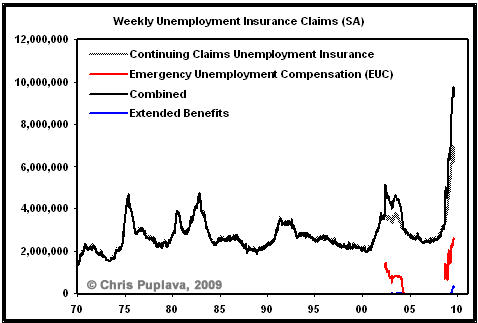
Continuing Claims Since 1970
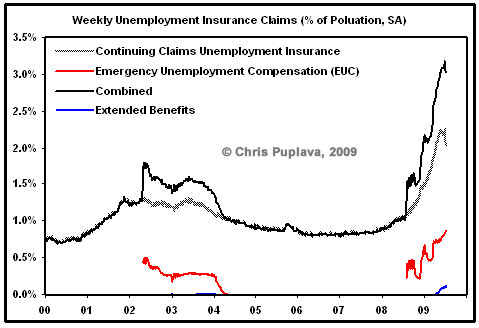
Continuing Claims as % of Population Since 2000
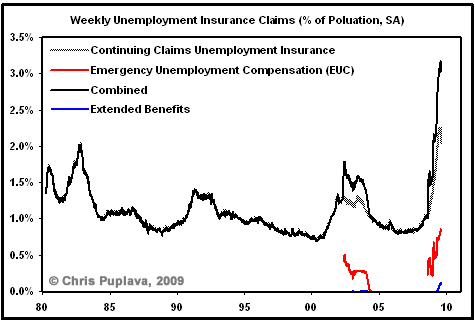
Continuing Claims as % of Population Since 1980
Chris notes "The EUC and the extended benefits come out with a lag as Moody’s had data for them only up to 07/11/09 while the continuing claims data is up to 07/18/09. The charts above are through 07/11/09."
Thanks Chris!
Unparalleled Continuing Claims
On a percentage of population basis this recession is unparalleled.
Making matters worse, the US consumer was nowhere near as leveraged to real estate in 1980 or 1982 as now. Also note that boomers are heading into retirement now, undercapitalized and looking for jobs, in effect competing against their kids and grandkids for jobs.
Look at the average age of baggers in grocery stores or greeters at Walmart. These people are not working because they want to; they are working because they have to. Demand for jobs is at an all time high while the number of available jobs and the pay scales of those jobs have both collapsed. The employment situation is not only an unmitigated disaster, things are about to get worse with pending state cutbacks.
Because of expiring claims, continuing claims data will soon start looking better. The reality however, is things will get worse for another year as unemployment soars into double digits. My forecast in January was 10.8% in 2010 while the Fed's was 8.5%. I see no reason to change mine, but the Fed upped theirs.
The implications for housing and especially commercial real estate are ominous.
By Mike "Mish" Shedlock
http://globaleconomicanalysis.blogspot.com
Click Here To Scroll Thru My Recent Post List
Mike Shedlock / Mish is a registered investment advisor representative for SitkaPacific Capital Management . Sitka Pacific is an asset management firm whose goal is strong performance and low volatility, regardless of market direction.
Visit Sitka Pacific's Account Management Page to learn more about wealth management and capital preservation strategies of Sitka Pacific.
I do weekly podcasts every Thursday on HoweStreet and a brief 7 minute segment on Saturday on CKNW AM 980 in Vancouver.
When not writing about stocks or the economy I spends a great deal of time on photography and in the garden. I have over 80 magazine and book cover credits. Some of my Wisconsin and gardening images can be seen at MichaelShedlock.com .
© 2009 Mike Shedlock, All Rights Reserved
Mike Shedlock Archive |
© 2005-2022 http://www.MarketOracle.co.uk - The Market Oracle is a FREE Daily Financial Markets Analysis & Forecasting online publication.