Elliott Wave Theory Suggests Bearish Outlook for Silver
Commodities / Gold & Silver 2009 Aug 10, 2009 - 05:24 AM GMTBy: Alistair_Gilbert
 Silver was decimated in last year’s market rout falling by over 80% in just seven months. Part of the reason is that it is not just bought for investment or jewellery purposes but is an industrial metal as well. Most people think of its industrial use in photography, but in fact it has myriad uses in the medical field because of its antibacterial qualities and more recently in creating superfibres for the clothing industry.
Polyester starts life as grain alcohol and, flowing over silver, is converted into ethylene oxide, the man-made fibre’s building block. Warm polyester fibre clothing -- which in the coldest weather wicks moisture away to keep the wearer dry -- is sweeping the outdoor clothing industry. It’s uses in electronics are well known as it is one of the best conductors of electricity. Many of you may already own American Silver Eagles.
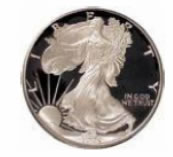 Since their introduction in 1986, American Eagles have become a leading silver bullion coin investment product with more than 180 million one-ounce coins sold.
Yet despite the fact that much of the silver used is recycled again, it has been running a mining deficit for 15 years now. That means that global consumption has exceeded that mined for the last 15 years. So why has the price not exploded? I think it soon will. Silver’s Bull market started in 2001 when it bottomed at $4.04 and at its peak last year it hit $21.35. That is a rise of 528% in seven years. I think that it will do that again in the next seven years. If we look at the quarterly chart below, we have only completed Major Wave 1 (and probably seen the low point of Major
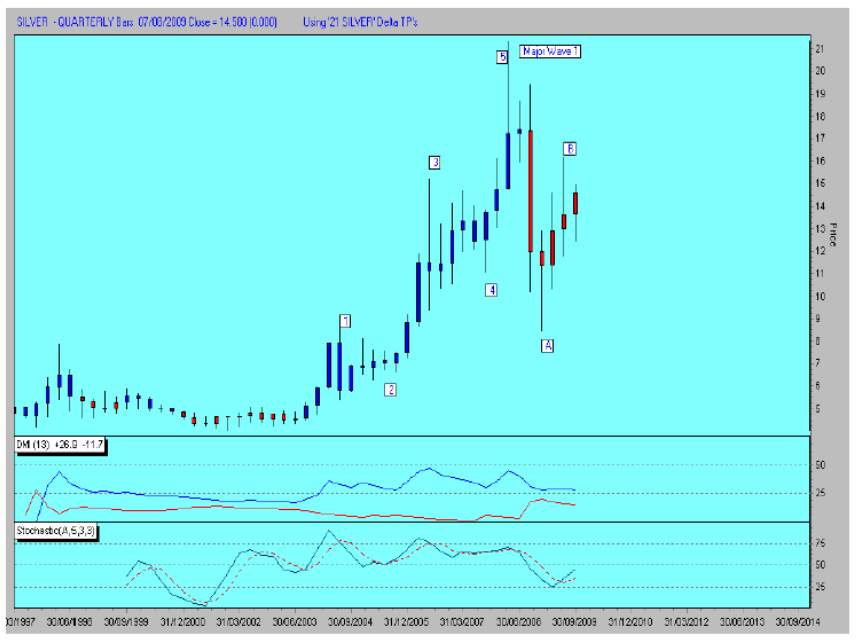
Wave 2.) We still have the biggest waves ahead of us! If you look at the DMI indicator, it is showing us that we are in a Bull market when the blue line is above the red line. Despite last year’s precipitous fall, it never crossed below the red line. The Stochastic is rising and has plenty more upside, but first, look at the DELTA candles. They are still red and that is warning us that first we must complete the “C” wave of major Wave 2 and that will probably take us down into early October.
If we move down to the Monthly chart, we can see that the DELTA LTD points very accurately call the highs and lows of the market. We are currently heading up to LTD 4 due in February 2010. This is reflected
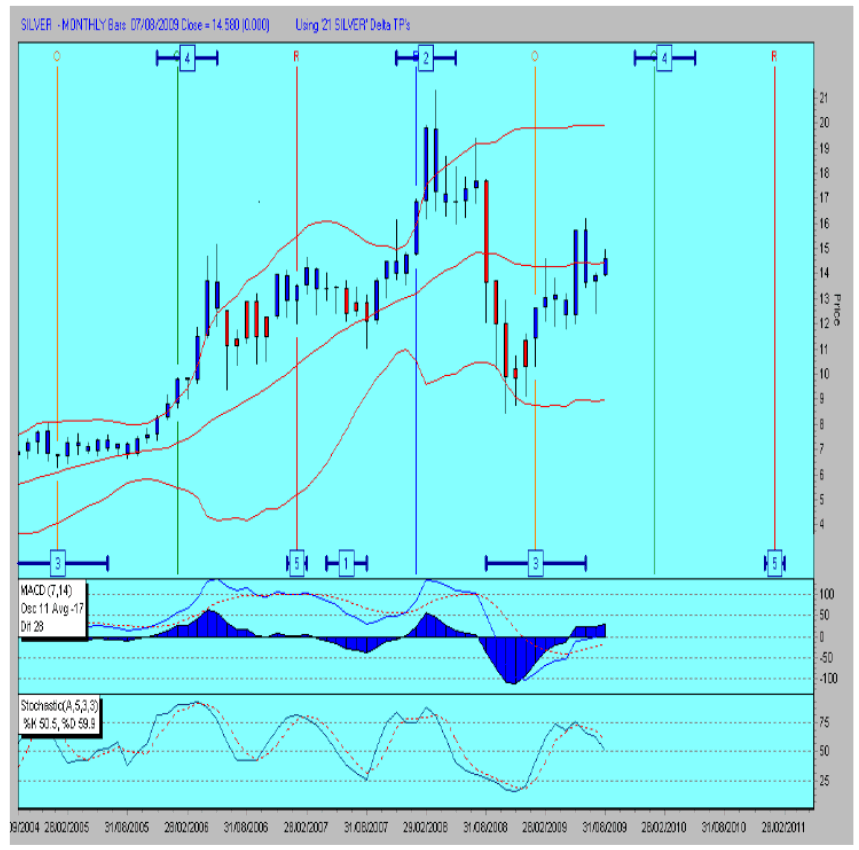
In the MACD histogram which has just moved positive but the more sensitive Stochastic is firmly pointing down in a rising market, warning us of the imminent correction.
Moving on to the weekly chart, we can see that the Medium 5 is due (and is probably in) and whilst the Stochastic remains positive, the MACD histogram has failed to rise above 0 despite a 250 point rise in silver and this has bearish implications for the weeks ahead
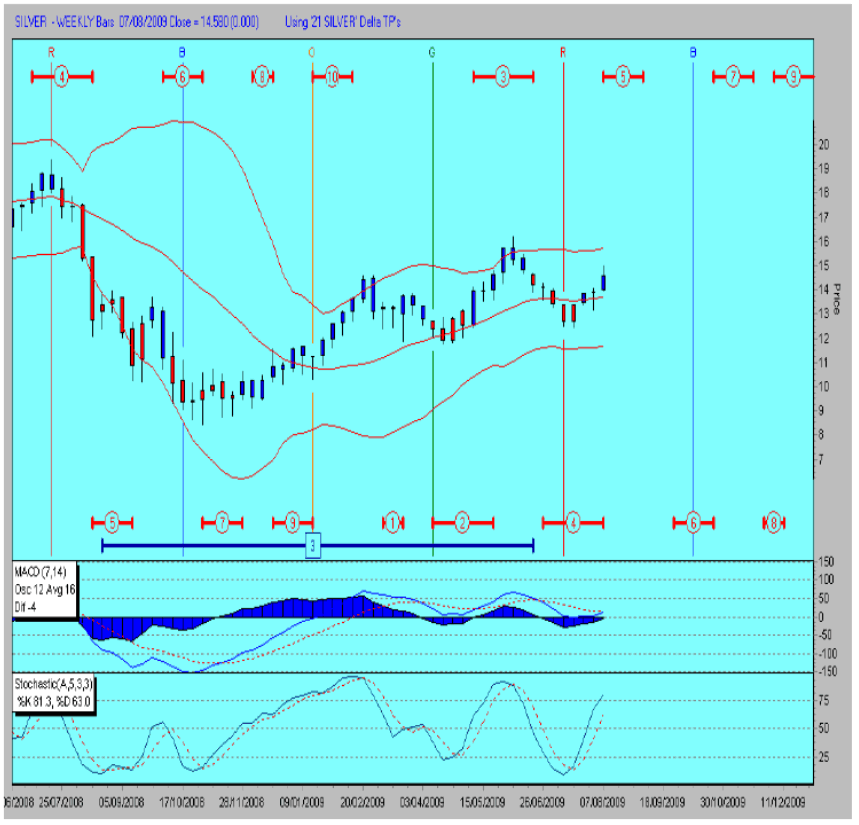
This is one of my most interesting finds in the Cycle work that I have done this last week. There is an 118 week Cycle and each time it has occurred at the top of a major “B” wave pinpointing the start of the “C” wave down. On each occasion the “A” was the largest wave!
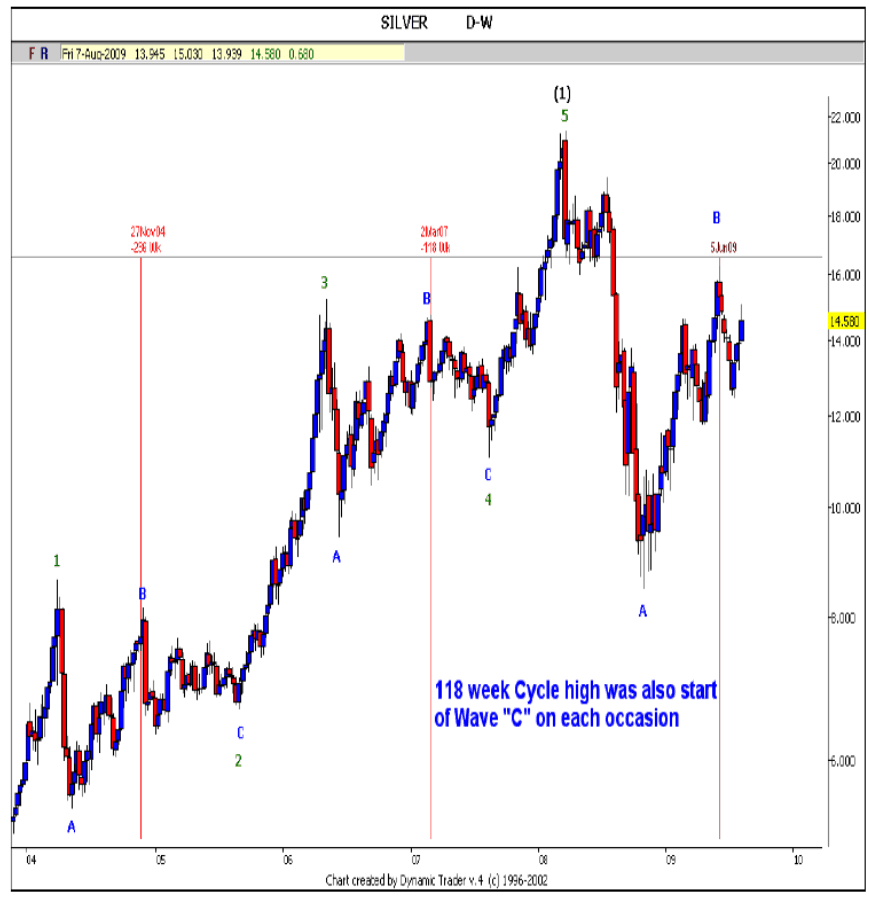
Moving on to my next Cycle, we have a 46 week Cycle high due this week, which may have happened a few days ago, but it ties in with the
top of Wave 2 of C. It is also worth noting that we are just completing the right shoulder of a Head & Shoulders top which projects down to about $8 which fits in with the $8.27 projection whereby Wave C = 61.8% of Wave A. However, because the right shoulder is higher than the left shoulder, this has bullish implications, and we know from DELTA that the bigger move is up into LTD 4 in February 2010, so we may get the C wave making a slightly shallower correction and the turn coming slightly earlier than the 61.8% in TIME.
I will keep you informed as the waves unfold and try and pinpoint the end of C. The main thing is that it looks like the top of Wave 2 of C was in on Thursday at $15.03 so traders should be looking for a sharp correction here in Wave 3 down.
By Alistair Gilbert
ALISTAIR GILBERT has worked in the markets for over 30 years. He has worked as an institutional research analyst for a firm of stockbrokers where he got his grounding as a technical analyst. He has also worked as branch manager of a firm of stockbrokers managing private client portfolios and as a fund manager for a leading merchant bank. Alistair was also Managing Director of a Swiss Fund Management group with over $1 billion under management and developed the business extensively in the Middle East.
Alistair has now returned to his native England where he now specialises in TIME and PRICE analysis utilising Elliott Wave, DELTA and a range of technical indicators. I can be contacted via alistair@alistairgilbert.com
Disclaimer: The ideas expressed in this Report are the thoughts of Alistair Gilbert and represent part of the intricate process that he goes through before arriving at a trading decision and as such are like a trading diary. Alistair Gilbert is not an authorised investment adviser and as such none of his statements should be construed as investment advice. The value of investments can go up as well as down and trading is very high risk. Readers are advised to consult with their own investment advisers who may be better qualified to offer a trading strategy based on your own individual circumstances.
Alistair Gilbert Archive |
© 2005-2022 http://www.MarketOracle.co.uk - The Market Oracle is a FREE Daily Financial Markets Analysis & Forecasting online publication.


