


GOLD Analysis and Trading Strategy for August 2009
Commodities / Gold & Silver 2009 Aug 11, 2009 - 01:21 AM GMTBy: Florian_Grummes

 It’s really getting interesting in the goldmarket. The big question is: “Will Gold break through the US$1000 level and advanced to new alltime highs or will it once again fail while trying ? To be honest: I am still quite sceptic at the moment. I expect another sell off, before Gold can run to new highs, but let’s have look at the charts first.
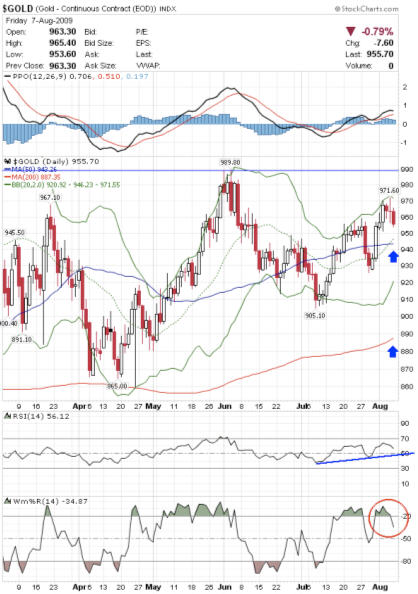
Gold Daily Chart
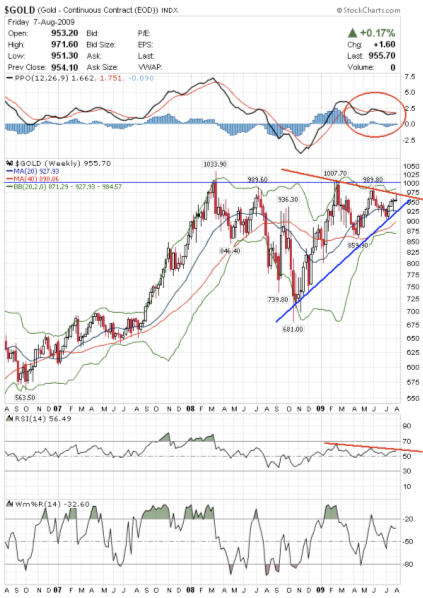
Gold Weekly Chart
Three weeks ago Gold could not conquer the US$950-957 level. After a few unsuccessful attempts a quick sell off pushed the price down to US$925. But from here Gold showed incredible strength again and within just a few days it went up to even US$970. This last Friday then Gold dropped after a volatile session down to US$954 with nearly no changes compared to the week before. Although it is still summer the volatility was rising strongly last week. It seems something will happen soon.
The technical picture still looks very positive. Gold is building up more and more pressure to break out of the triangle & through US$ 1.000. The rising 50d MA (US$943,26) and the 200d MA are moving up parallel. All trendlines are in place and in the last month every pull back was bought immediatley.
Unfortunately the little double top at US$ 970 (Tuesday & Thursday last week) as well as the big distance to the rising 200d MA (US$887,35) reminding us to stay alert. Also the upper Bollinger Band (US$971,55) is the next resistance. And most important the intraday-reversal in the Dollar on Friday could be the start of a suprising Dollar Rally.
So far the correction since the all time high in March 2008 (US$1.037) is still in play. To end the correction a sustainable move above of the US$1.000 level is necessary.
Shortterm another attempt up to US$970-990 seems possible. But for that an immediate renewed dollar weakness will be necessary. If the August monthly close is above US$960 it is highly likely that we see the breakout to new alltime highs very soon.
On the other hand Gold should not fall below US$944 anymore otherwise we shall witness another sell off down to the at least the US$920-900 level.
The long term technical & fundamental perspective for gold is still super bullish. The next price targets are the Fibonacci‐Extensions of the complete correction since March 2008 at US$1.250 and U$1.600.
The DowJones/Gold ratio is now at 9.80. The world wide stock market rally should have reached its final stadium. At the end of August or the beginning of September the bears will be back. In 2001 the DAX recovered within 6 month from 3.539 up to 5.467 points and then dropped down to 2.188 points within the next 12 months! We have witnessed very similar price action during this spring & summer so far….
Long term I expect the price of gold moving towards parity to the Dow Jones (=1:1). The next primary cyclical change therefore is still years away. This means we are in a long term bull market in gold (and also commodities) and in a secular bear market in most of the stock markets.
Gold in EUR (one ounce = 672,47€)
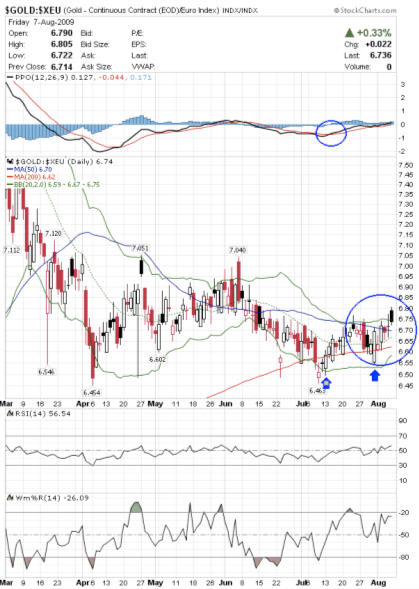
Gold in Euro – Daily Chart
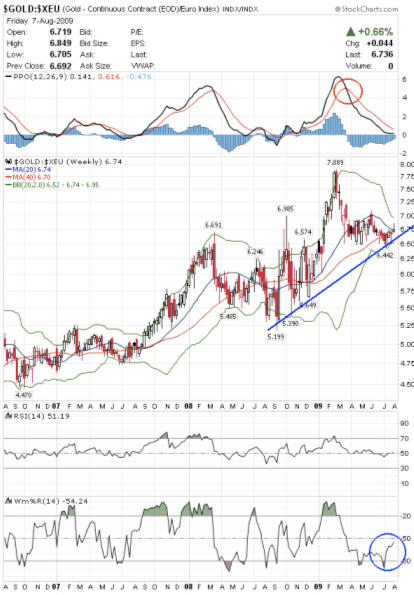
Gold in Euro – Weekly Chart
As well in EUR Gold is moving slowly but surely higher.
The rising 200d MA (662€) has been tested twice in July and is still an important support. If that support fails we will see much lower prices. But from a technical perspective this is pretty unlikely at the moment.
Instead after getting back above the falling 50d MA (670€) Gold should reach the 700€ level soon. Both Bollinger Bands were contracting during July down to a range of less than 18€ which indicates that now a bullish breakout is next.
As an EUR Investor the price of gold calculated in EUR is far more important for you than in US$. Don´t fool yourself. From a longerterm perspective Gold is still a very good buy at or below 675€ an ounce.
Gold COT Data
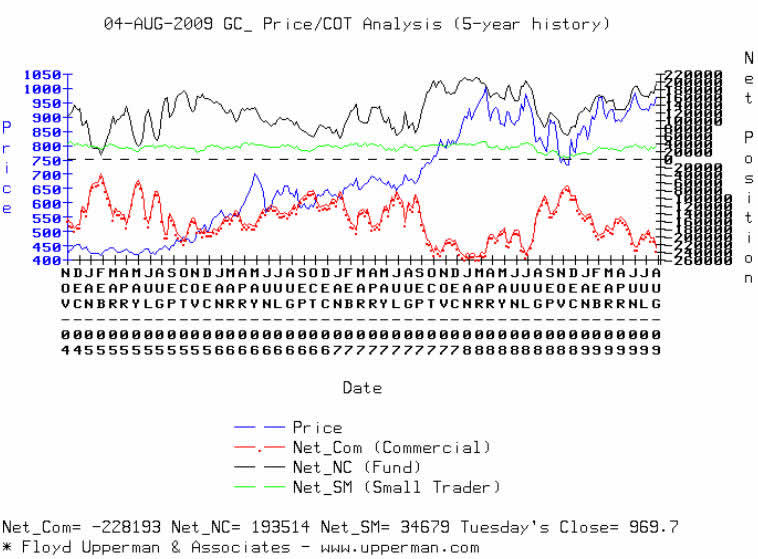
The commercial shortposition is again at frightening highs! This was neither 2005 nor 2007 the case before the big rallies in the goldmarket started. The commercials are more contracts short than at the end of February 2009. At that time Gold dropped from US$990 down to US$863.
Of course one can argue that the Commercials are short since 2001 and from that perspective they were not „right“ the last eight years. But they always build up their position in rising prices and they covered them not before a dramatic panic driven selloff. And they surely earned a lot of money by doing so.
I still believe that a new rally in the price of gold can only start, if the commercials reduce their short positions to below 100.000 contracts. Below 900US$ the Commercials should cover more of their positions. If we see a last sell off down to US$880-845 to get rid off the the weak hands the COT data should look very positive again.
18.04.2009 = -153.419 ( PoG Low of the day = US$ 885 ) 19.05.2009 = -183.065 ( PoG Low of the day = US$ 920 ) 26.05.2009 = -208.136 ( PoG Low of the day = US$ 939 ) 02.06.2009 = -226.521 ( PoG Low of the day = US$ 970 ) 23.06.2009 = -194.430 ( PoG Low of the day = US$ 913 ) 14.07.2009 = -182.287 ( PoG Low of the day = US$ 917 ) 21.07.2009 = -204.226 ( PoG Low of the day = US$ 944 ) 28.07.2009 = -202.521 ( PoG Low of the day = US$ 934 ) 04.08.2009 = -228.193 (PoG Low of the day = US$ 950 )
Gold Seasonality
August is a Pivot month. Normally this month brings the decision about what’s going in the market for the next 6 to 9 months. Normally starting around August the price of gold rallies until the next spring. Therefore the seasonality perspective supports higher prices in the weeks & months ahead.
Gold Sentiment
Most of the time big rallies and new bull markets are born in a panic sentiment after a strong sell-off (e.g. DOW in March). At the moment most of the market commentators and the „gurus“ expect the breakout very soon. To me the sentiment feels way too positive and I am not planning to be moving with the crowd.
Gold mining stocks analysis
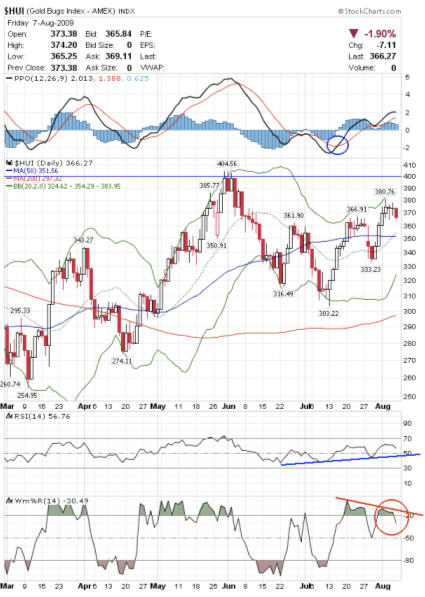
Goldbugs Index USD (366,27 Points) - Daily Chart
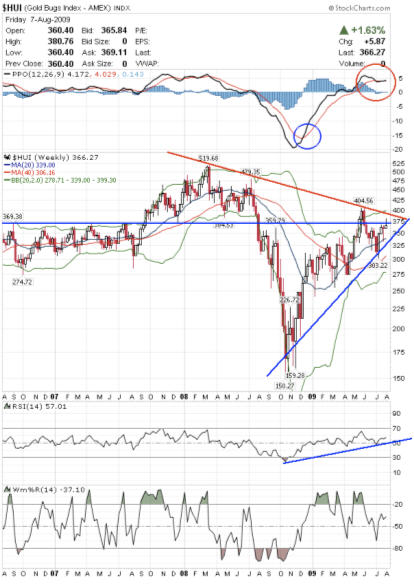
Weekly Chart
Parallel with the DOW, DAX, most of the stock markets & Gold, the HUI gold mining stocks went up as well during the last couple of weeks.
So far at 380 points the rally ended last Tuesday. Since then the HUI is slowly moving down. A failure of support around 360-365 would be a sell signal.
Until now the buy signal created by the MACD in early July is still in play. The upper Bollinger Band (US$383,95) makes higher prices in the coming week possible. The flat 50d MA (351,56) and the rising 200d MA Tagelinie (297,32) are running parallel like they do on the gold chart. Everything looks nice.
But the HUI did not confirm the last high in the Goldmarket on Thursday which is a clear warning sign. Most of the time the gold mining stocks are running ahead of gold itself.
As well I have to remember you again that gold mining stocks are moving parallel with the broad stock market. If we see a strong sell off in the stock market this autumn the HUI will be beaten down too. But in that case we will have a great buying opportunity.
Conclusion
The next weeks will be very interesting. There are a lot of technical evidence for the final breakout to the upside very soon. But if the long term bear market in stocks shows up again Gold will be hit as well. I therefore recommend to watch the charts very carefully.
A rise above the US$ 990-1000 level confirms the seasonal pattern. Then we should see the next leg of this gold bull market and prices around US$1.500 in spring 2010. A pull back below US$940 indicates another wave of correction down to at least US$900-920 or even US$880-845. This could last even until early October before gold might be ready to challenge the 1.000 level again. By then (with a better COT picture) I expect Gold to be finally successful.
If you would like to receive these free trading reports or my trading signals please visit this link: Free Weekly Trading Reports - Click Here
By Florian Grummes
www.TheSilverGoldSpot.com
Learn to Trade ETF's While Your Making Money Trading
© 2009 Copyright Florian Grummes - All Rights Reserved
Disclaimer: The above is a matter of opinion provided for general information purposes only and is not intended as investment advice. Information and analysis above are derived from sources and utilising methods believed to be reliable, but we cannot accept responsibility for any losses you may incur as a result of this analysis. Individuals should consult with their personal financial advisors.
Florian Grummes Archive |
© 2005-2022 http://www.MarketOracle.co.uk - The Market Oracle is a FREE Daily Financial Markets Analysis & Forecasting online publication.