


Get Ready to Buy Gold
Commodities / Gold & Silver 2009 Aug 13, 2009 - 03:34 AM GMTBy: MoneyWeek

 Dominic Frisby writes: Regular readers will know I have been looking for an 'entry point', a good time to buy gold sometime in the summer. Yet, except for a momentary blip a fortnight ago, there has been no sell-off of any great note. Gold continues to range-trade between about $970 per ounce on the upside and $910 on the down.
 But as I suggested on Monday - Today's biggest contrarian bet - the US dollar - it seems a rally of sorts is starting in the US dollar, so we should get a corresponding drop in gold priced in dollars.
And if stock markets turn down from here, we can expect gold and gold shares to follow, at least at first.
If you don't already own some gold or gold shares, I really would take advantage of any dips you might see in the coming few weeks, because, longer-term, a number of indicators are suggesting gold could be getting ready for a big move. Let me explain...
This first chart shows the gold price this year and, beneath, the seasonal pattern of gold over the last 37 years. (Thanks to Nick Laird of www.sharelynx.com for the latter). Seasonal trading strategies don't always work, but this year gold has followed its annual pattern. The black arrows show the year's major highs and the red arrows the major lows. Except for January, all have come pretty much on cue. Quite amazing.
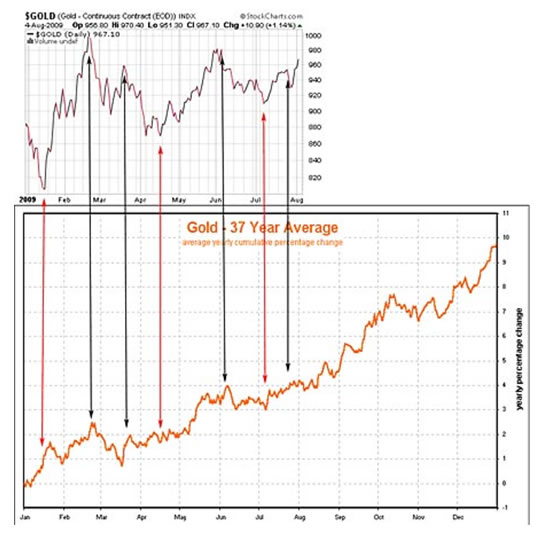
If the seasonal pattern continues to play out, we can expect significantly higher prices by year-end, with an October sell-off en route.
Is $1000 the new $700?
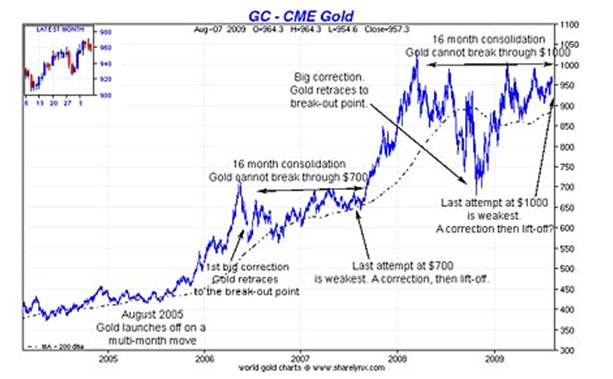
Many will remember the big move in gold from about $430 to $730 an ounce between August 2005 and May 2006. There then followed a frustrating sixteen-month period, which began with a violent correction that took gold back to the point it had broken out from. Gold then edged its way up, making higher lows and repeatedly trying and failing to break through $700. It made four attempts and couldn't get past $680. The fourth attempt was the least convincing of all.
Then, suddenly, in September 2007, it burst through on a dramatic, multi-month up-move that took it to $1,030 by the following March.
Enjoying this article? Sign up for our free daily email, Money Morning, to receive intelligent investment advice every weekday. Sign up to Money Morning.
The post-big-move corrective pattern then repeated itself. First we had the dramatic correction where gold made its way back to its breakout points. The first was at $850, then, in last year's stock market crash, it fell to its initial break-out point at $680. Since then it has edged higher, making consistently higher lows.
But it hasn't broken out to new highs. In fact, it has re-tested $1,000 some four times now – just as it did at $700 - and last week's rally, which couldn't even pass $970, was the least convincing of all.
If this pattern continues it means a major, multi-month move - which will propel the price beyond $1,000 - is coming. You want to make sure you've booked your seat on the rocket, either though gold or an associated share such as an exchange traded fund (ETFS physical gold ETF (LSE:PHGP) for example). Yes, somebody might get a seat a little bit cheaper, but better this than not having a seat at all.
Many technical analysts look for so-called "fractal patterns" – basically these are recurring patterns in stock charts - which they then use to predict future price movements. The technique doesn't always work, but it has a surprising success rate. The advantage is you know pretty quickly when you are wrong, so you can place tight 'stop losses' to minimize your risk of losing money.
The share price pattern that points to a gold surge
Ross Clark of Institutional Advisers is for me one of the best technical analysts around. He notes that the pattern gold has been making as it consolidates in the 16 months since its high of spring 2008, and repeatedly fails to break through $1,000, is remarkably similar to the US Dow Jones Industrial Average – Wall Street's bellwether share index - in the 16 years between 1966 and 1982, as it repeatedly failed to break through $1000.
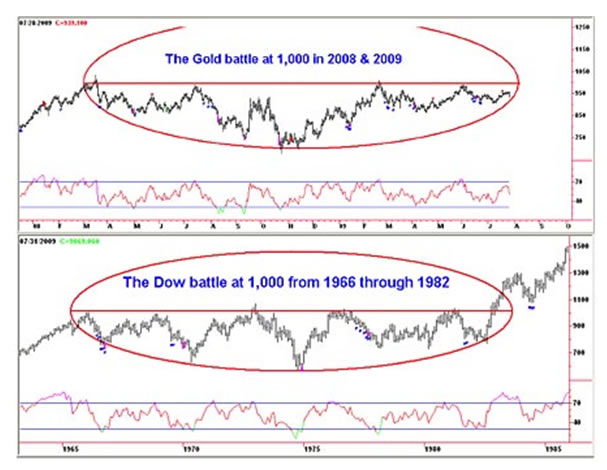
The Dow eventually went to 14,000. I am not saying gold will go to $14,000, or anything like, and if it's to go anywhere significant the breakout point must hold on any subsequent retest, just as the Dow did. But don't underestimate how high the yellow metal and its miners could rise.
For now, be careful
There are three things that make me very cautious in the short term. The first is that a continued rally in the US dollar will knock gold. The second is the widespread bullishness amongst commentators. We need some kind of a sucker punch. And the third is the positioning of professional traders on the Comex futures exchange. Large traders have a sizeable 'long' position while commercial traders have a similarly sized 'short' stance, i.e. they have sold gold they don't own. Together, this isn't usually indicative of a gold price low, as I explained last week in Money Morning: Gold looks ripe for a fall – so get ready to buy in.
The dollar gold price could easily be taken down $100 from here, so be careful. But also be careful not to miss out on gold's next big move.
By Dominic Frisby for Money Morning , the free daily investment email from MoneyWeek magazine .
© 2009 Copyright Money Week - All Rights Reserved
Disclaimer: The above is a matter of opinion provided for general information purposes only and is not intended as investment advice. Information and analysis above are derived from sources and utilising methods believed to be reliable, but we cannot accept responsibility for any losses you may incur as a result of this analysis. Individuals should consult with their personal financial advisors.
Money Week Archive |
© 2005-2022 http://www.MarketOracle.co.uk - The Market Oracle is a FREE Daily Financial Markets Analysis & Forecasting online publication.