


Stock Market Dumb Money indicator Continues to Hit New Extremes
Stock-Markets / Stock Index Trading Aug 16, 2009 - 11:28 AM GMTBy: Guy_Lerner

 The "Dumb Money" indicator continues to hit new extremes despite last week's slight down market. The Rydex market timers continue to be bullish and leveraged to the extreme. And to round out our sentiment analysis, selling by company insiders has hit extremes as well. It is the perfect trifecta. Whether the perfect trifecta becomes the perfect storm (again) for investors is yet to be determined.
The "Dumb Money" indicator is shown in figure 1. The "Dumb Money" indicator looks for extremes in the data from 4 different groups of investors who historically have been wrong on the market: 1) Investor Intelligence; 2) Market Vane; 3) American Association of Individual Investors; and 4) the put call ratio.
Figure 1. "Dumb Money" Indicator/ weekly
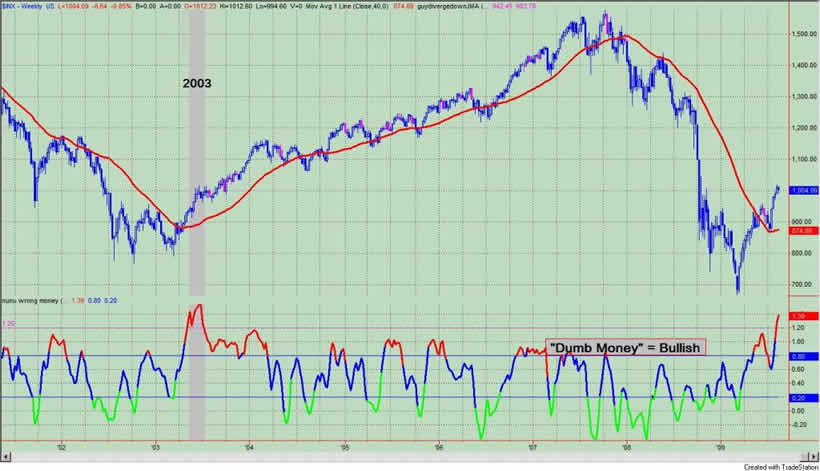
What I said last week still stands, and I would apply 3 interpretations or scenarios to the current extreme readings in the "Dumb Money" indicator:
"1) This is a bull market, and as we know, it takes bulls to make a bull market. Extremes in investor sentiment - just like over bought signals - are irrelevant.
2) Even though prices may be higher over time, the market is likely to consolidate (i.e., trade in a range) over the next couple of weeks; referring back to figure 1 and the 2003 time period, we note that the market actually went sideways for about 13 weeks following the extremely extreme extremes in investor sentiment. I suspect that this will be the most likely scenario for now.There will be a bid under the market. It will be tough to short or bet against this market for the foreseeable future.
3) The last scenario is that the current extremes in investor sentiment will mark the price highs in the major indices leading to the mother of all fake outs. This scenario is still very much on the table, but with an expected bid below the market, I don't see the market making a sudden reversal anytime soon. Market tops are a drawn out affair!"
For those who haven't read my "stuff" before, one of my favorite aspects of the Rydex data is the amount of assets in the bullish and leveraged funds versus the amount of assets in the leveraged and bearish funds. Not only do we get to see what direction these market timers think the market will go, but we also get to see how much conviction (i.e., leverage) they have in their beliefs. See figure 2 a daily graph of the S&P500 (symbol: $INX) with the Rydex leveraged bulls (green line) versus the leveraged bears (red line) in the lower panel. Typically, we want to bet against the Rydex market timer even though they only represent a small sample of the overall market.
Figure 2. Rydex Bullish and Leveraged v. Bearish and Leveraged
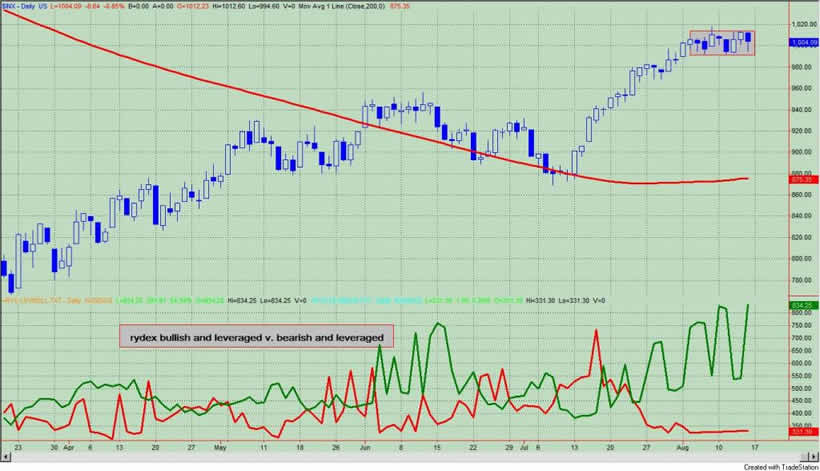
We note that the number of those market timers that are bullish and leveraged is once again very extreme (2.52 times) relative to the bearish and leveraged cohort. Since this started occurring on a regular basis on August 4 (or 9 trading days ago), the S&P500 is down over that period time. Yes, it is down only 1.5 points but what an accomplishment that is in this very bullish environment!!!
Our last look at sentiment comes from Insider Score, which is a service that provides information on company insider buying and selling utilizing a proprietary algorithm. See figure 3, which is a weekly chart of the S&P500. The indicator in the lower panel is Insider Score's "entire market" score, and this score is wrapped in trading bands. The current value is now outside the lower band and 2 standard deviations below the mean. This suggests significant insider selling.
Figure 3. Insider Selling/ weekly
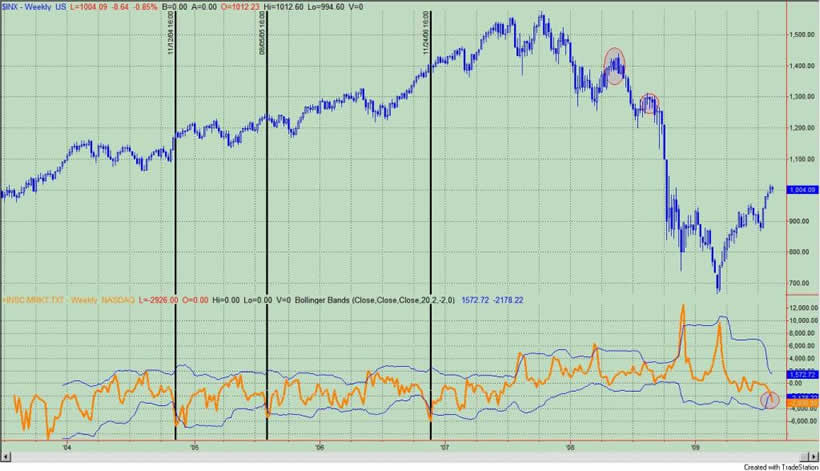
There were 3 other prior and noteworthy extremes over the past 6 years of data, and these are noted with the black vertical lines. They were: 1) November, 2004; 2) August, 2005; and 3) November, 2006. Two other things about insider buying and selling are noteworthy. One, insiders continued to buy the dips during the early stages of the bear market in November, 2007 and January, 2008; they had no clue as to what was ahead. So sometimes insiders can get it wrong. Two, the current value on the Insider Score data is significantly below (i.e., increase in selling) the value seen in April, 2008 and September, 2008. These time periods are noted with the gray ovals over the price bar and led to major flushes in the markets.
Over the past 3 months every technical or fundamental signal to sell the market has been a reason buy. The bulls will tell you that this is just the "wall of worry" necessary for stocks to go higher or this is how bull markets act. All that may be true, but really, this is also just nonsensical dogma. On the other hand, the data would suggest that this is not the time or place to be making that big bet on the long side. From my perspective, there are better risk adjusted opportunities ahead.
And finally, at this point in time, it is too early to say whether the perfect trifecta will turn into the perfect storm.
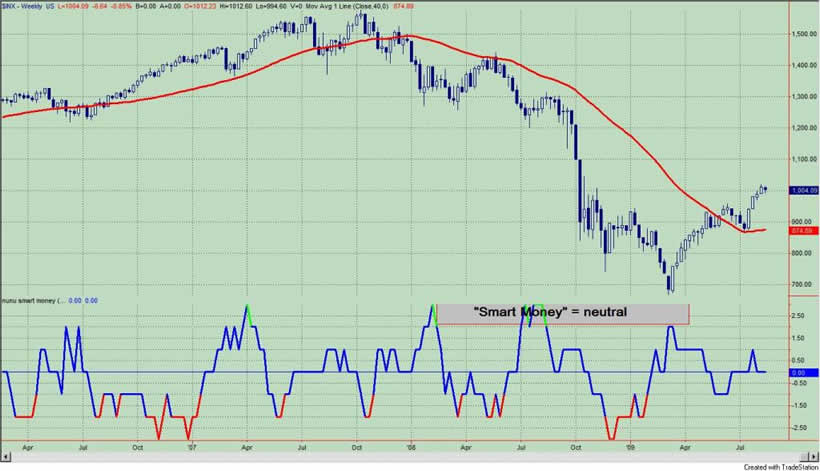
The "Smart Money" indicator is shown in figure 4. The "smart money" indicator is a composite of the following data: 1) public to specialist short ratio; 2) specialist short to total short ratio; 3) SP100 option traders. The "smart money" is neutral.
Figure 4. "Smart Money" Indicator/ weekly
By Guy Lerner
http://thetechnicaltakedotcom.blogspot.com/
Guy M. Lerner, MD is the founder of ARL Advisers, LLC and managing partner of ARL Investment Partners, L.P. Dr. Lerner utilizes a research driven approach to determine those factors which lead to sustainable moves in the markets. He has developed many proprietary tools and trading models in his quest to outperform. Over the past four years, Lerner has shared his innovative approach with the readers of RealMoney.com and TheStreet.com as a featured columnist. He has been a regular guest on the Money Man Radio Show, DEX-TV, routinely published in the some of the most widely-read financial publications and has been a marquee speaker at financial seminars around the world.
© 2009 Copyright Guy Lerner - All Rights Reserved
Disclaimer: The above is a matter of opinion provided for general information purposes only and is not intended as investment advice. Information and analysis above are derived from sources and utilising methods believed to be reliable, but we cannot accept responsibility for any losses you may incur as a result of this analysis. Individuals should consult with their personal financial advisors.
Guy Lerner Archive |
© 2005-2022 http://www.MarketOracle.co.uk - The Market Oracle is a FREE Daily Financial Markets Analysis & Forecasting online publication.