Gold Bulls and Bears Fight To Standstill, Trend About to Resolve
Commodities / Gold & Silver 2009 Aug 18, 2009 - 02:50 AM GMTBy: Clive_Maund
 Gold's bulls and bears have fought each other to a standstill so that an eerie calm now exists in the gold market, rather like the period in Europe known as the Phony War which was an early stage of the 2nd World War, where despite having declared war on each other, the major powers did not engage in significant military operations. Just as this phase was the "calm before the storm" it is clear from an examination of the gold chart that this time of tranquillity is about to end - that much we can be fairly sure about.

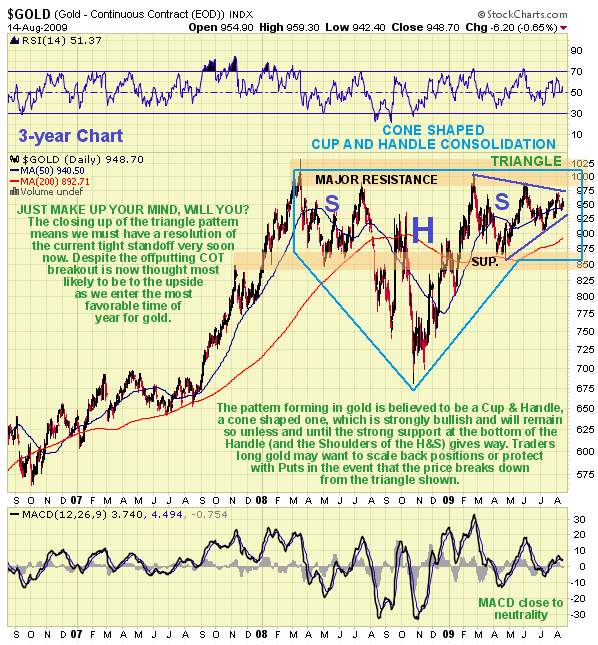
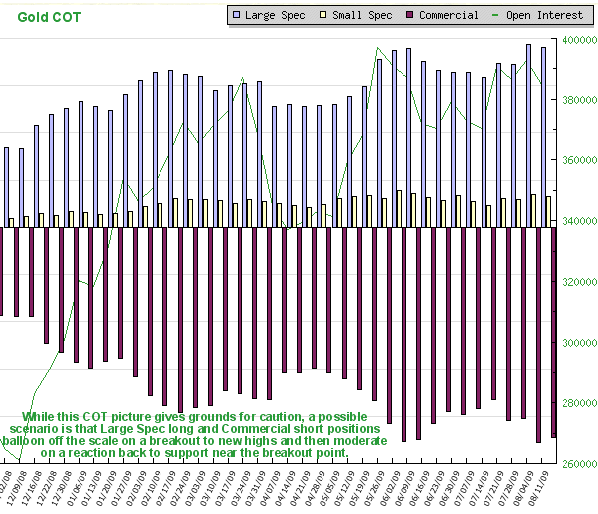
When you weigh up the conflicting indications, it is small wonder that neither bulls nor bears have thus far been able to get the upper hand. Looking at the 3-year chart we can see that we have to take into account the following factors. Gold has since early last year marked out a potential cone-shaped Cup-and-Handle consolidation which is bullish, simulataneously a Head-and-Shoulders continuation pattern, which is bullish, but also a pattern that might turn out to be a Double Top, which is obviously bearish. Moving averages are all in bullish alignment and would support a breakout to new highs, and seasonal factors are strongly in gold's favor as we approach September, but the COT structure for gold is that which typically precedes a downturn.
The number of advisors calling for a gold breakout to new highs is at a very high level, which is normally a contrary indicator, but this is complicated by the fact that it includes many of the best analysts in the business. In addition gold and silver lease rates have dropped close to zero, indicating that storage space is scarce, meaning that they are piling up somewhere. This is what is happening with various base metals whose quantities in storage have risen to "nosebleed" levels - this is bearish because it reveals that instead of being bought to meet industrial demand, these metals are being hoarded by speculators. The exception is copper which it is suspected is being squirreled away by the Chinese "somewhere the sun don't shine". It would appear that "Son of Bubble" is coming of age - do people learn from the past? - no, of course not. Crude oil stocks are also at historic highs, which is not good news for oil prices, and a background negative factor for gold. The standoff in gold is also a reflection of the still unresolved inflation/deflation dilemma.

So, short of spinning a coin how do we decide, in advance, in the face of all these conflicting factors which way gold is going to break? The answer is we don't - we let the market declare itself. Looking again at the 3-year chart we can see that the price of gold has been fluctuating in an ever narrowing range for months and that these fluctuations have now become very narrow indeed as it approaches the apex of a Symmetrical Triangle from which it must break out soon. Those familiar with Catastrophe Theory will know that in a situation like this some exogenous event that is unforeseeable can be expected to trigger breakout one way or the other, which due to how finely balanced the situation is does not have to be of momentous significance.
With respect to this, however, Big Money knows that a breakout will force a lot of traders to come off the fence, and it has the manipulative power to trigger a false breakout, and whipsaw a large number of traders out of their positions before reversing prices back in the opposite direction. Our approach therefore is to watch for a breakout from the Triangle shown, buy or sell on the basis of the direction of breakout, but be ready to reverse position rapidly if the price doubles back across the nose of the Triangle - got it? - good. A factor to keep in mind is that although it makes it more probable, an upside breakout from the Triangle does not guaratee a breakout to new highs, but it should at least lead to a challenge of the highs. Likewise a breakdown does not mean a bear market in gold, but would be expected to lead to a return to the support at the bottom of the Triangle in ther $850 area. Another point worth noting is that even though the COT data is at levels that in the past have led to a decline, what could happen is that gold breaks out anyway and the Large Spec long and Commercial short positions balloon to levels that are off the scale, but then moderate on a subsequent reaction back towards the breakout point.

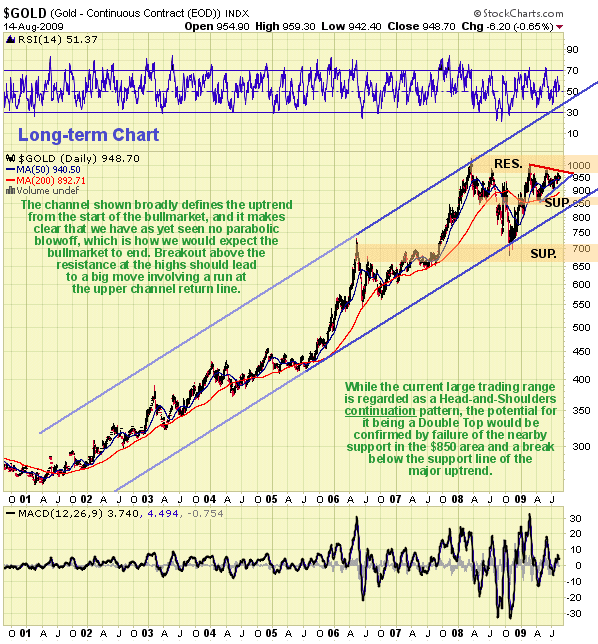
The long-term chart for gold is encouraging as it shows that, despite the toppy looking formation of the past 18 months, it remains within a broad long-term uptrend and as yet there has been no parabolic blowoff top, which is how we would expect this bullmarket to end. However, failure of the nearby support in the $850 area followed by failure of the major uptrend would be clearly bearish developments.

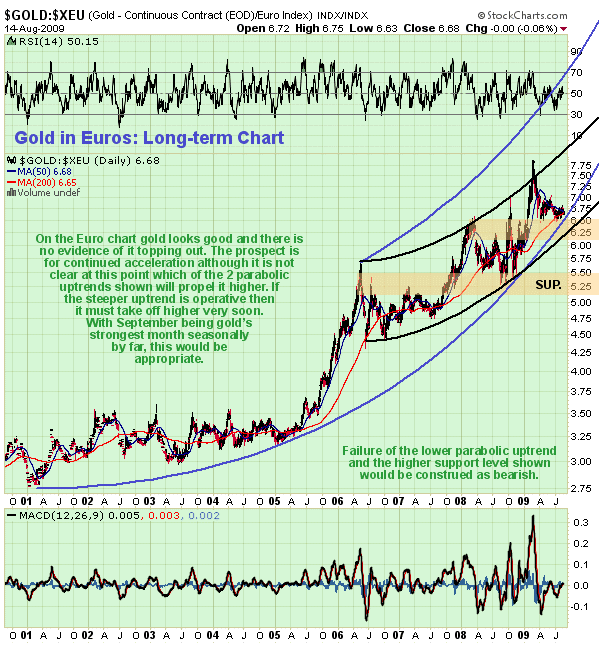
The long-term chart for gold measured in other currencies looks completely different. Against the Euro, shown here, we can see that it still looks very positive and is in fact in position to accelerate significantly to the upside. However, should gold break below the lower parabolic uptrend on the Euro, which would probably synchronize with a failure of the long-term uptrend on the normal dollar chart, it could lead to a serious decline.
Gold ETF`s are not regarded as worthy substitutes or proxies for gold itself. Those who feel that they are would do well to get themselves a powerful magnifying glass and spend a weekend reading the prospectuses of these ETFs with special attention to the terms and conditions.
On the site we have a special subscriber only article just posted looking at the stock of the legendary handgun manufacturer Smith & Wesson, whose chart may come as a surprise to many. There is a correlation between the quantity of gold and silver being bought for private stockpiling with the sales of handguns, so it is relevant for us to consider the stocks of companies that make them, especially if they look like they are going up substantially. Smith & Wesson is a stock that is regarded as being immune to recession/depression, no matter how bad it gets short of revolution.
By Clive Maund
CliveMaund.com
For billing & subscription questions: subscriptions@clivemaund.com
© 2009 Clive Maund - The above represents the opinion and analysis of Mr. Maund, based on data available to him, at the time of writing. Mr. Maunds opinions are his own, and are not a recommendation or an offer to buy or sell securities. No responsibility can be accepted for losses that may result as a consequence of trading on the basis of this analysis.
Mr. Maund is an independent analyst who receives no compensation of any kind from any groups, individuals or corporations mentioned in his reports. As trading and investing in any financial markets may involve serious risk of loss, Mr. Maund recommends that you consult with a qualified investment advisor, one licensed by appropriate regulatory agencies in your legal jurisdiction and do your own due diligence and research when making any kind of a transaction with financial ramifications.
Clive Maund Archive |
© 2005-2022 http://www.MarketOracle.co.uk - The Market Oracle is a FREE Daily Financial Markets Analysis & Forecasting online publication.


