Summer Outlook for Gold
Commodities / Gold & Silver Jun 17, 2007 - 04:38 PM GMTBy: Jordan_Roy_Byrne
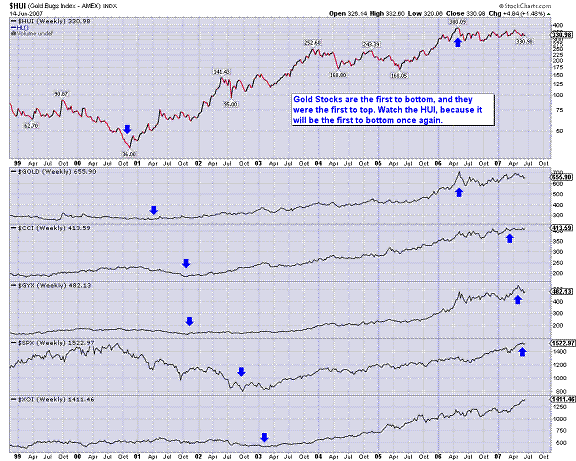
To understand why gold is "lagging" we need to compare it to other sectors of the market.
The following chart shows that gold and gold stocks are "leading indicators." This is confirmed by the fact that neither gold nor gold stocks have made a new high in 2007, while other market sectors have made new highs this year. These areas (stock market, continuous commodity index, base metals and the oil stocks) are close to topping if they already have not topped.

In recent weeks I have been writing about and showing the charts that illustrate how gold and gold stocks actually perform best during a period of contraction. The action of the past year has left with some the thought that the stock market has to do well for the precious metals to rise. Actually, gold has just been acting as a leading indicator and soon we can expect the stock market and the commodity sector to turn down. Ultimately, the precious metals will turn up first followed by the commodity sector and then the stock market. When will the precious metals bottom?
First let's take a look at the HUI:

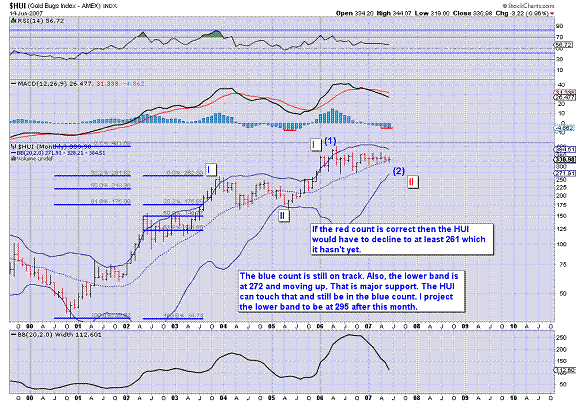
This is a Monthly chart that shows my two potential wave counts. The main question is if the recent consolidation is an ongoing correction of the May 2005 to May 2006 advance, or if it is a correction of the entire move from late 2000 into 2006. The evidence points to former. Now more importantly, where might a bottom occur?
The 270 level has proved to be strong support during the past year and a half. Now we see the lower Bollinger band at 272 and rising. I project it to be at 295 in July. This lower band is likely to provide very strong support. In May of 2005, the index traded about 6% below the band at its final bottom. 6% below 295 amounts to 277.
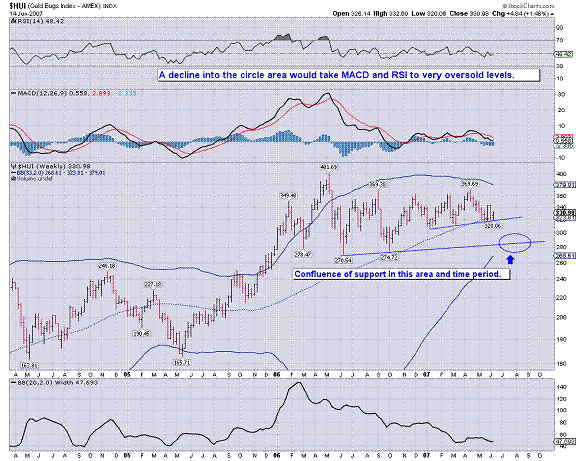
Here is a zoomed in weekly look with equivalent Bollinger bands:

This points to 290 as being key support in the July to August timeframe. I should also mention that throughout this consolidation period, the HUI has held 290 on a weekly closing basis, as well as 300 on a monthly closing basis. Be sure to keep these various points in mind as the HUI prepares to make a final bottom.
Now let's take a look at Gold:

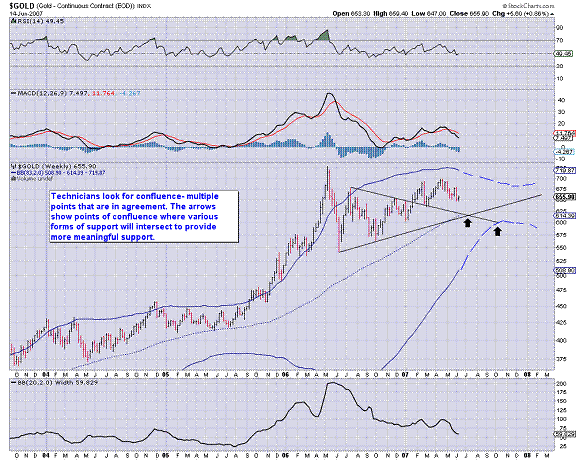
This is a weekly chart and I am using Bollinger bands that are roughly equivalent to 20-month bands.
There is a confluence of support at, let's say a week after July 4. You have two trendlines that have provided support and in addition you have the mid-line (in between the Bollinger bands) in that vicinity. Call the point $610-$615. You also have confluence at about $600 at the end of September where the lower band and one trendline should meet.
In short, fairly soon we could see a sharp decline into July down to $610-$615, followed by a nice reflex rally back up to $640-$650. Then during the later stages of summer gold could begin its decline towards a major bottom.
For more fundamental and technical analysis and to see our model portfolio, sign up for our free email newsletter on this page of our website: http://trendsman.com/?page_id=17
By Jordan Roy-Byrne
trendsman@trendsman.com
Editor of Trendsman Newsletter
http://trendsman.com
Trendsman” is an affiliate member of the Market Technicians Association (MTA) and is enrolled in their CMT Program, which certifies professionals in the field of technical analysis. He will be taking the final exam in Spring 07. Trendsman focuses on technical analysis but analyzes fundamentals and investor psychology in tandem with the charts. He credits his success to an immense love of the markets and an insatiable thirst for knowledge and profits.
Jordan Roy-Byrne Archive |
© 2005-2022 http://www.MarketOracle.co.uk - The Market Oracle is a FREE Daily Financial Markets Analysis & Forecasting online publication.


