


Stocks & Commodity Markets Technical Analysis - Trader's Paradise
Stock-Markets / Financial Markets Jun 17, 2007 - 06:44 PM GMTBy: Dominick
 Last week reminded our members why they love logging-in each and every day. While the S&P turned out a 25 point gain, we produced four times that amount before Thursday's PPI report as we traded every turn like no other site possibly could have. The year of volatility we predicted in January continued in full force, giving us juicy moves that proved very profitable for members of TTC, but not so much for most others.
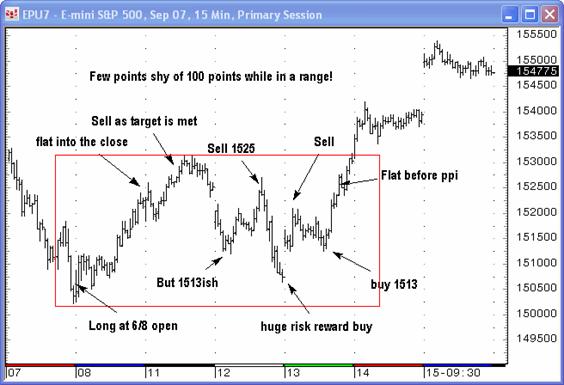
The chart below outlines all the trades announced in the forum and chatroom in realtime last week. From last Friday to this Wednesday, the market had been stuck in a range that whipsawed many traders who were simply looking to play the breakout. We instead found all the setups below which allowed members to take advantage of a market environment that's become nothing short of a trader's paradise. Adding up all the swings, we produced a gain of just shy of 100 points, unbelievable profits while trading within a range.
Some would be quick to say that just holding last week's position would have realized a twenty-five point gain, and they'd be right. Now, that may be good enough for some, but I say no way! First you would have needed to have bought that exact low last Friday, but more importantly, you would have had to hold on as the market retraced back within two points of that level on Tuesday's globex low. Remember that, at the time, this was a powerful looking drop that seemed it would tear out the previous lows, which is exactly what most analysts on Wall Street were forecasting! Reputable Elliott Wave traders and technicians came out with their bearish 3 rd of a 3 rd of a 3 rd idea that night, but unfortunately, in a game that only has two directions, they again picked the wrong direction and sold the low and were forced to cover into the highs.
Make no mistake, simple analysis of an S&P chart reveals that most traders were on the wrong side of the market again as it set up the trap door on Tuesday and Wednesday. The surge in the last two days of the week was not traders going portfolio shopping, but bears forced out of the market by margin clerks.
If they were members at TTC they would have been alerted to very important turns since last Friday, along with many intraday moves. Last Friday's idea was to buy the open as we thought the move down was corrective and we also knew that some large houses were buying in the pit. Tuesday's drop setup a potential 2-5 point loss to take a shot at a 50-100 point gain. You can do the math for yourself, but we saw it as risk/reward trade we needed to take. As it happened, any swing trader that took that trade and is still long has a gain of close to 50 points in three days!
This raises the question why I was the only one that I know of to see that huge risk/reward trade using the Elliott Wave principle when there's so many who claim to use this discipline? Only one answer comes to mind, and it's that most aren't using "unbiased" Elliott Wave. It's not just our proprietary indicators, our unique blend of market indicators, our weekly maps, daily forums, or realtime chatroom – it's our commitment to unemotional trading based on the setups given by the market instead of predetermined sentiment or predictions that make TTC a highly profitable trader's paradise. But everything else helps, too!
The way we played the week was to buy 1507 into Tuesday's close, and again at 1504 in the globex session. After that, buyers decided to understand the setup and began to bid up the market overnight. By the time we got up in the morning the Futures were already up to 1514. We then rallied most of the morning and started to pull back ahead of the 2:00 report, which some were expecting to use as an excuse to turn the market lower. We placed our buys at 1513 that afternoon and our longs were triggered as the futures made a low into 1512.50. From there, staying long was easy with price exploding upward. That didn't stop bearish traders from pushing their wave 2 targets higher in the face of an obviously impulsive move. Of course, Friday's gap trapped all the foolish traders harboring those silly thoughts.
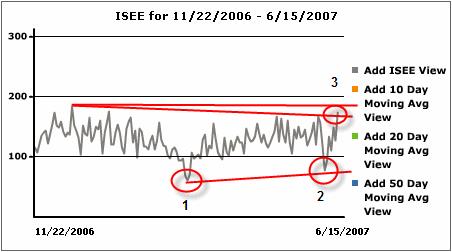
In last week's update I discussed that we had bought the June 8th lows at the opening bell in part because the trading community had again become too bearish. The updated chart below shows the March low (#1) in relation to the most recent low (#2), clearly displaying the spike in bearishness as formulated by the ISEE. As you can tell, the mood of option players had swung wildly the other way by Friday's close (#3), really in only one week's time. I don't think we've reached a level you could call capitulation, but we look close.
This confirmation from the sentiment indicator lines up perfectly with my current Elliott Wave work. Actually, it's a needed ingredient for which I've been waiting patiently. We've been bullish while many other have been extremely bearish, and I believe we can see a time in the near future where that situation reverses. In fact, I invite bearish traders and analysts of the last five years to become bullish as I start taking the moth balls off my bear suit. I think we'll see that day come, and with it, an important turn.
Looking forward
This week's action has left two obvious gaps in the S&P futures which make the first question whether a third one is needed to complete the three gap play. With Friday's gap, we also have an Island left in place. We'll be monitoring these gaps as they represent clues of what to expect.
Two other things we'll be sure to monitor are my long-awaited target of the 2000 highs and our July 4th turn. I'm very excited to have navigated the last few turns as if we had the newspaper day's in advance and hope to do the same here because I truly believe we have the map. Members first were introduced to the Dow map at the March lows and it continues to guide us through this relentless, yet choppy rally.
Weeks ago I stated;
“So, we're going into the next few weeks with a plan and are looking forward to seeing it realized. On the contrary, most traders will probably be in for a few weeks of very frustrating trading before the final curtain falls on this rally.”
This week proves us 100% correct on that statement! Members knew that we had originally looked for a drop to 1485 that we wanted to buy with both hands.
Then at the exact lows to receive a screaming buy really puts it all together.
Gold
Despite the broad market rally, gold and silver failed to close above their 5-day moving averages, the key level watched by Joe's Precious Points update in recent weeks. This obvious resistance level will be the first obstacle to a sustained rally, followed by even stronger resistance further overhead if it's breached. Be sure to read the rest of Joe's weekly article for more on precious metals.
Proprietary Trend charts
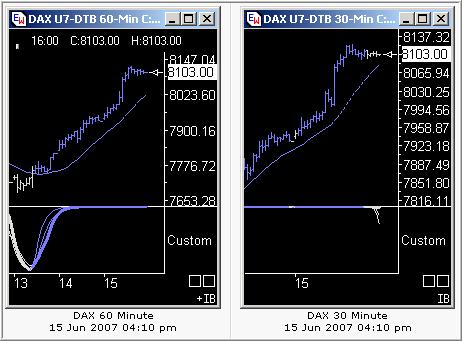
My Trend charts continue to not only confirm each week's moves, but lead the way. In a week that we had the lows almost give up on Tuesday, and most traders worried about PPI, CPI , and every other report on the calendar keeping us out of the game, the trend charts simply said to BUY. That proof is on the charts below of the Dax. The S&P trend charts gave the same results.
Members
Be sure to visit the Weekly Maps. As many of you know, the Weekly Maps section of the site is where I lay out the big picture ideas for the following week along with charts from any other markets that seem to be playing a part in what we trade.
Non Members
We work hard for our continuously profitable setups and they've been more than proven in the seemingly unbelievable results published in this free update for well over a year. At $50/month the current price of joining our trader's paradise is really not an issue, especially considering this discount price is only available for two more weeks.*
*To Current and Prospective Members:
TTC will be increasing its monthly subscription fee on July 1st. The increase has become inevitable due to our ongoing expansion of the Website, computer and software upgrades, and the addition of services such as trend cycle charts. Current members and anyone that joins before the increase takes effect will not be subject to the new price, and will continue paying the current $50 subscription fee on a month-to-month basis. So, if you have been thinking of joining, this is a great time.
Thank you for your attention to these changes. If there are any questions, please direct your email to admin@tradingthecharts.com .
Have a profitable and safe week trading, and remember:
“Unbiased Elliott Wave works!”
By Dominick
For real-time analysis, become a member for only $50
If you've enjoyed this article, signup for Market Updates , our monthly newsletter, and, for more immediate analysis and market reaction, view my work and the charts exchanged between our seasoned traders in TradingtheCharts forum . Continued success has inspired expansion of the “open access to non subscribers” forums, and our Market Advisory members and I have agreed to post our work in these forums periodically. Explore services from Wall Street's best, including Jim Curry, Tim Ords, Glen Neely, Richard Rhodes, Andre Gratian, Bob Carver, Eric Hadik, Chartsedge, Elliott today, Stock Barometer, Harry Boxer, Mike Paulenoff and others. Try them all, subscribe to the ones that suit your style, and accelerate your trading profits! These forums are on the top of the homepage at Trading the Charts. Market analysts are always welcome to contribute to the Forum or newsletter. Email me @ Dominick@tradingthecharts.com if you have any interest.
This update is provided as general information and is not an investment recommendation. TTC accepts no liability whatsoever for any losses resulting from action taken based on the contents of its charts, commentaries, or price data. Securities and commodities markets involve inherent risk and not all positions are suitable for each individual. Check with your licensed financial advisor or broker prior to taking any action.
Dominick Archive |
© 2005-2022 http://www.MarketOracle.co.uk - The Market Oracle is a FREE Daily Financial Markets Analysis & Forecasting online publication.