


Gold and Silver Hidden Chart Messages
Commodities / Gold & Silver 2009 Aug 30, 2009 - 01:42 PM GMTBy: Ronald_Rosen

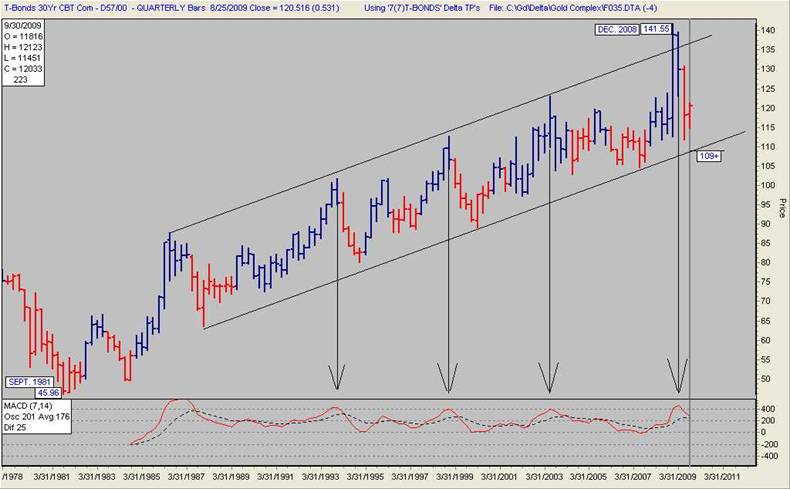
 We may have seen a blow off high for the 30 year T-bond when the price moved up and out of the channel that has been in effect since 1987. This channel was in place for 22 years without being violated in either direction. A blow-off high may indicate that a breach of the lower channel line will occur. A close below the lower channel line will indicate rising interest rates. That would be bullish for the U. S. Dollar and bearish for gold Vis a Vis the U. S. Dollar.
30 YEAR T-BOND QUARTERLY CHART
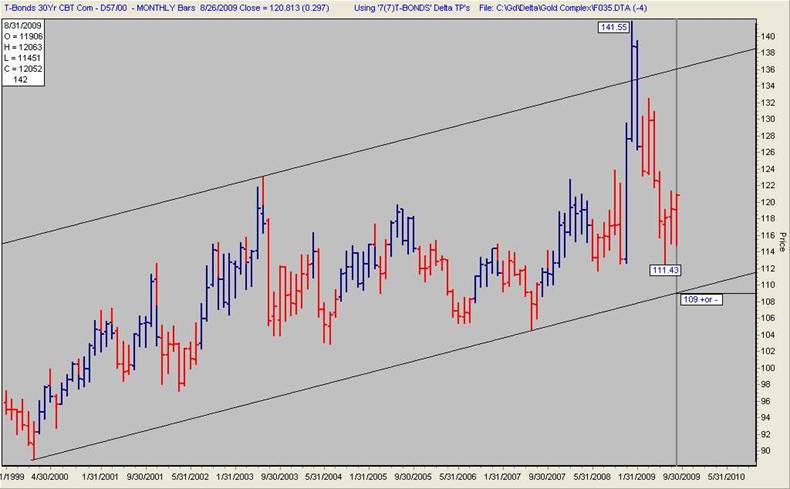
This monthly chart of the 30 year T-Bond shows the 22 year channel. A final blow-off
move is often indicative of a reversal of trend about to occur. A blow-off move out of a 22 year old channel may be a warning of major changes taking place. A change of the long term trend for the 30 year T-Bond means higher interest rates.
30 YEAR T-BOND MONTHLY CHART
And so it is that your sea-going scribe, Cap’n Ron, has warned subscribers not to expect an imminent parabolic move to the sky for the precious metals complex. In due time yes but there are indications hidden in the charts that may be telling us not yet, not yet. Some headlines from the past may have, unbeknownst to many, provided the answer to why a modicum of patience is required and should be exercised by gold aficionados.
======================================================
|
“BAD THINGS COME IN THREES”
The Boston Globe (Boston, MA)| December 8, 1999| Frank Dell'Apa, Globe Staff ---------------------------------------------------------
|
=======================================================
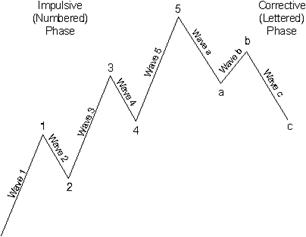
Corrections in a bull market also tend to occur in three waves. The bullish impulse tends to have five waves. Not everything traded in all markets unfolds in clearly identifiable Elliott Waves, far from it! However, for whatever reasons, precious metal items tend to adhere to classic wave patterns. When classic wave patterns in gold, silver, and the HUI have been reasonably identifiable, they have been worth paying attention to. Identifiable wave patterns coupled with Delta Long Term turning points properly placed can be of substantial timing assistance. In once again posting the long term charts of gold, silver, and the HUI, I am attempting to show why we should not be overcommitted to the precious metals complex at this time.
Before I go any further please recognize that my report is technical in nature. I do not write or often comment about fundamentals. The fundamentals regarding gold, silver, the HUI, and the U. S. Dollar are amply covered in numerous letters, reports, specials, and alarming notices and books that the economic world as we have known it is coming to an end. They rarely tell us when but they do elaborate profusely on what a disaster you face if you do not have most of your assets in gold and silver. Well, maybe yes, maybe no. I, for one, can not predict the future. That is why I keep repeating that I always look for the highest probabilities. The problem with that is I will never know if I have the highest probability until after the event takes place.
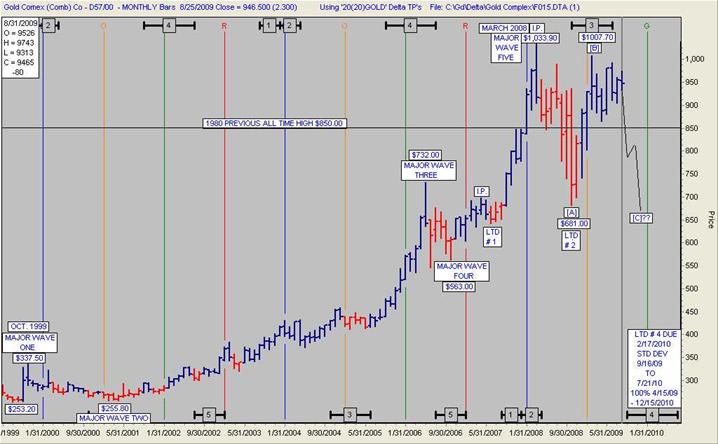
What is relatively clear on a probability basis is that gold, silver, and the HUI, based on the wave theory, are missing a corrective [C] leg down of an [A], [B], [C], major correction. As I previously wrote, the wave theory for whatever reasons has been a difficult but reasonably good way to identify moves in the precious metals complex. Coupled with the proper application of the Delta Long Term turning points the wave theory becomes an excellent timing tool. Of course, you need someone who is capable of applying and identifying the turns using Delta and the wave theory. I believe that I am reasonably good at doing just that. Long time subscribers will remember that there are various ways of identifying times to be cautious regardless of how bullish the overwhelming numbers of advisors are.
I believe, based on the Delta Long Term turning points coupled with the wave theory, this is a time to be cautious and aware of a potential severe decline in the precious metals complex. On to the charts and the missing third legs down. Being an old sea Cap’n, I guess you can say that I am looking for “Peg Leg Pete.” He is our crew member who can tell us much about missing legs.
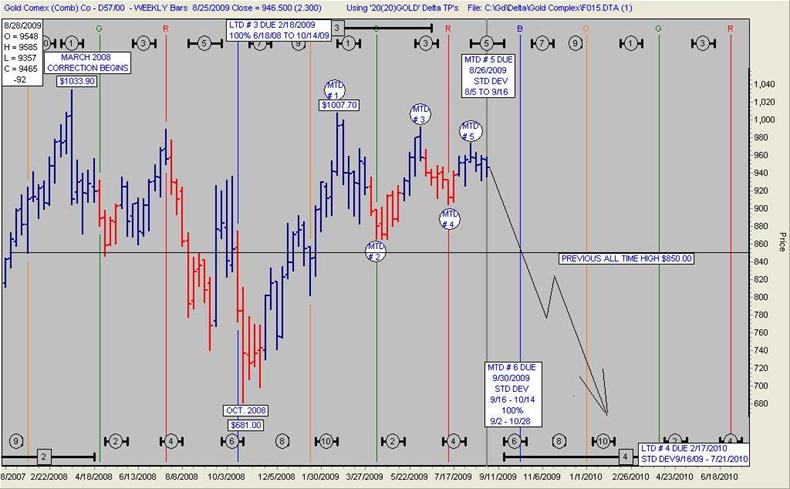
Gold bullion has completed 5 waves up and is working on its 3 waves down. The final [C] leg down of the 3 wave correction is missing and may soon begin. When the [C] leg is complete the next bull phase should begin.
A key reversal on this chart is represented by a half red, half blue vertical monthly line. The (W) leg down had a key reversal. The probable (Y) leg down began with a key reversal.
double zigzag
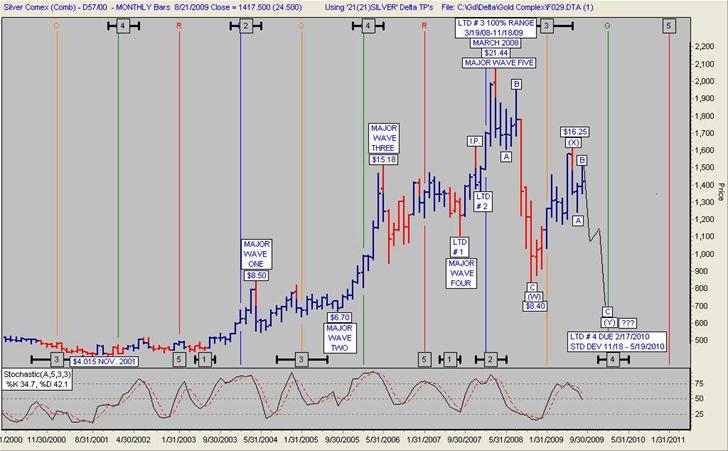
SILVER MONTHLY 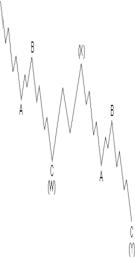
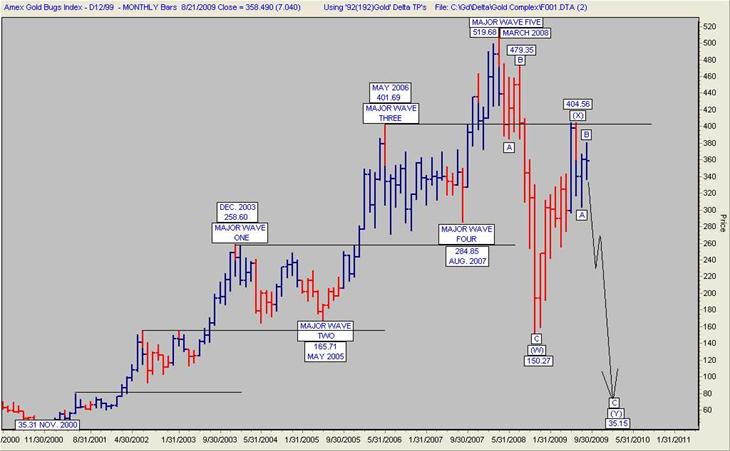
A key reversal on the HUI chart is represented by a half red, half blue vertical monthly line. Every key reversal since the bull market began has resulted in a decline.The (W) leg down began with a key reversal. The probable (Y) leg down began with a key reversal.
double zigzag
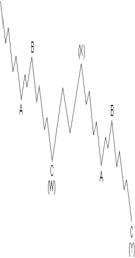
HUI MONTHLY
If the projected final [C] legs down in gold, silver, and the HUI are as severe as the charts may be telling us, the opportunity to buy low priced gold, silver, and precious metal shares will be extraordinary. This [C] leg down that I am describing will not be the beginning of a prolonged correction; it will be the end of a prolonged correction that began in March 2008.
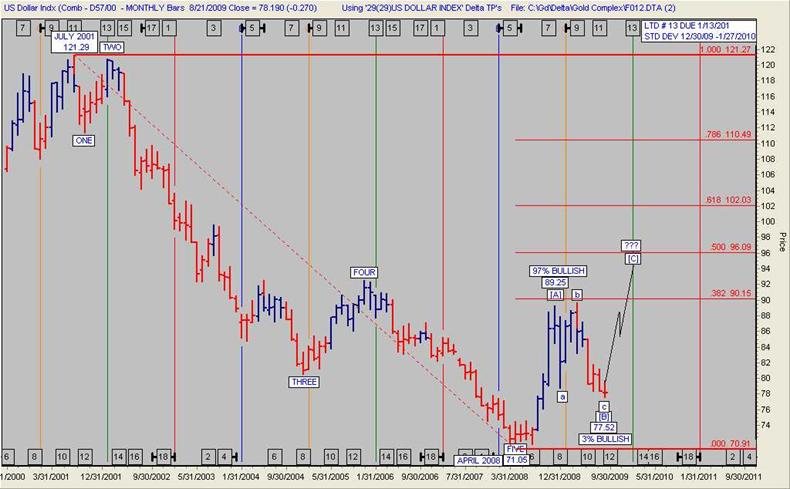
The enemy of the bull market in the precious metals complex has proven to be a rising U. S. Dollar. Just as the precious metals appear ready to complete a final [C] leg down in their prolonged bull market correction, the U. S. Dollar Index appears ready to begin its final [C] leg up in its major bear market rally.
U. S. DOLLAR INDEX MONTHLY
Subscriptions to the Rosen Market Timing Letter with the Delta Turning Points for gold, silver, stock indices, dollar index, crude oil and many other items are available at: www.wilder-concepts.com/rosenletter.aspx
Ron Rosen
M I G H T Y I N S P I R I T


Ronald L. Rosen served in the U.S.Navy, with two combat tours Korean War. He later graduated from New York University and became a Registered Representative, stock and commodity broker with Carl M. Loeb, Rhodes & Co. and then Carter, Berlind and Weill. He retired to become private investor and is a director of the Delta Society International
Disclaimer: The contents of this letter represent the opinions of Ronald L. Rosen and Alistair Gilbert Nothing contained herein is intended as investment advice or recommendations for specific investment decisions, and you should not rely on it as such. Ronald L. Rosen and Alistair Gilbert are not registered investment advisors. Information and analysis above are derived from sources and using methods believed to be reliable, but Ronald L. Rosen and Alistair Gilbert cannot accept responsibility for any trading losses you may incur as a result of your reliance on this analysis and will not be held liable for the consequence of reliance upon any opinion or statement contained herein or any omission. Individuals should consult with their broker and personal financial advisors before engaging in any trading activities. Do your own due diligence regarding personal investment decisions.
Ronald Rosen Archive |
© 2005-2022 http://www.MarketOracle.co.uk - The Market Oracle is a FREE Daily Financial Markets Analysis & Forecasting online publication.