Gold, A Technical Macro and Micro View
Commodities / Gold & Silver 2009 Aug 31, 2009 - 08:24 AM GMTBy: Bill_Downey
 The seasonal factor for the gold market is due to turn up in the month of September. But we want to ask ourselves, WHAT needs to happen for it to kick in? Well, certainly the psychology has to be there. More importantly however, demand must be there. And what is the most likely demand factor this time of year? Christmas & holidays and India's wedding season.
First Christmas & holidays
The gearing up for Christmas (depending on product lead times) usually starts kicking in right after Labor Day. The initial orders for raw material used to ramp up the manufacture of products for the holidays is usually where it all starts. The 64K dollar question this year is "how brisk will the shopping season be?" and with gold at record prices, how much expenditure will there be in that avenue?
So the Christmas buying (and it is all estimated) will be a factor. Will merchants keep the orders low expecting a Christmas bust? Hard to say, but odds suggest it will be LOWER than in previous years.
And then there's India
This excerpt taken from JULIAN PHILLIPS – at GoldForecaster.com
The heaviest influence on this seasonal pattern of Gold Prices has been jewelry demand from India, where as much as 850 tones of gold per annum was imported in previous years. This demand from Indian jewelry buyers was, in turn, driven by the weather.
In the past, 70% of India's gold demand came from the agricultural sector, all of which is dependent on the weather and seasons. And after May, crops have to be planted ready for the coming monsoon rains, bringing the crops to fruition in the early-to-middle parts of August.
In India, Gold means far more than just jewelry for adornment, however. It has religious connotations as well as financial importance. Gold makes an auspicious investment during the Hindu festival season, for example – most especially the Diwali festival in October.
What's more, in a country where respect for the civil service, appliers of the law and the tax authorities is extremely low, the attraction of changing your tax-free agricultural profits into Gold and property – and then slipping under the tax radar – is often irresistible.
And India, one might be wise to keep tabs on the "crops" and how their yields and quantities play out. The current threat is the rainfall situation there. Taken from http://www.agrometeorology.org/.. (there's a 29 page report - very detailed)
The subdivisions like Haryana, Chandigarh & Delhi, Himachal Pradesh, East Madhya Pradesh received scanty /deficient rain in all the 5 weeks; Orissa, West Uttar Pradesh, Jammu & Kashmir, West Rajasthan, East Rajasthan,West Madhya Pradesh, Gujarat region, Saurashtra & Kutch, Konkan and Goa, Marathwada, Vidarbha,Chhattisgarh, Telangana, Coastal Karnataka, Kerala received scanty / deficient rain in 4 out of last 5 weeks;Jharkhand, East Uttar Pradesh, Uttarakhand, Punjab, Madhya Maharashtra, Coastal Andhra Pradesh, Rayalseema,TamilNadu & Pondicherry, North Interior Karnataka, Lakshadweep received scanty / deficient rain in 3 out of last 5 weeks. Remaining States received normal / excess rain in 2 or more weeks during last 5 weeks.
And from Reuters http://in.reuters.com/..
-------------------------------------------------------------
CROP JULY ESTIMATE MAY ESTIMATE PCT CHANGE
-------------------------------------------------------------
RICE 99.15 99.37 -0.22
WHEAT 80.58 77.63 +3.80
COARSE CEREALS 39.48 48.67 -18.88
LENTILS 14.66 14.18 3.68
CORN 19.29 18.48 +4.38
OILSEEDS 28.16 28.12 0.14
COTTON 23.16** 23.20 -0.17
SUGARCANE 271.25 289.23 -6.21
---------------------- --------------------------------------
** bales of 170 kg each
(Reporting by Mayank Bhardwaj; Editing by Bryson Hull
Bottom line: I am no expert in India's agriculture. However, rain will probably be the key factor to look for. The "GOVT" report I read said the crop is in satisfactory to good condition. Counter that with an article I read a few weeks back that suggested a 35% potential drop due to drought !~!!!
Such is the information age. What does one believe?
Finally, there's one more factor................. THE "INDIVIDUAL" investor. They are the wild card of the bunch. All of the reports circulating the web suggest that demand is heavy and running at or near record levels. What makes it a wild card is how small the universe of gold is compared to the "paper" markets of the world. It would take a very small portion of total paper asset money shifting to completely upset the supply demand factors associated with gold.
The Gov't is well aware that AN OUTRIGHT PANIC could have substantial consequences when it comes to the price of gold. But in desperate times people do desperate things.
It has been reported that the central banks are now NET buyers of Gold. Do you think they know something the public doesn't and is it bullish? In other words, are they the smart money, or the DUMB money? Ah, perspective is everything. You decide.
Central banks turn net buyers of gold in second quarter of 2009: WGC
http://economictimes.indiatimes.com/..
Reality vs. Reality TV
And then there are the scary stories as I like to call them. Some call them the gloom and doom, or the conspiracy stories. The stories are rampant on the net.
Examples are: There's no gold in fort Knox, there is a banking holiday coming, there is hardly any gold left to buy, the COMEX is about to shut-down........ there is another meltdown coming, no one but the Fed is really buying any of our bonds, the unemployment rate is really 16%, the US dollar is about to collapse, the real estate market drop is only half over, the social security fund is empty, California is selling Arnold autographs on E-BAY to make payroll, the national guard has interim camps built and they are hiring "Internment Specialists" for when civil unrest breaks out, the precious metals markets and every other market is being totally manipulated.
See what I mean about scary though?
Don't get me wrong either. I am not making light of ANY these stories. On the contrary, most of them are downright worrisome and these stories are coming from people with pretty credible names. Now, I will admit, a lot of these and other stories have surfaced, but none of them have come to fruition…………………….......YET. (Note: Arnold is selling autographed stuff on E-bay for the state of California).
Let us not kid ourselves for one moment. The world as we know it came close to an end last year. Read that again. Yea. It was that big. Whether it was by hook or by crook is a story for another day.
The point I want to make is eventually.....and maybe sooner than later, either a complete hyper inflationary scenario or a massive credit contracting deflationary event is going to take place. And how you position yourself is going to determine how much of your purchasing power you’re going to retain. Odds suggest that time is fast approaching.
That's the bottom line folks. And that's where gold enters the picture. Not only is the world in a deep set of weeds, the demand/supply factor for gold looks very bullish as well.
So how do we know then if all of these factors are coming into play or will come into play?
PRICE.
Wells Wilder and Jim Sloman summed it up well. (from the book, "What matters is profits")
Price is all that matters in the end. Everything known about the market is reflected by price. All fundamentals are contained in it. Price is the effect of volume, open interest, and the psychology of the market. Supply and demand is contained in price. When everything is reflected, summed up and discounted about a market.............you arrive at price.
Price is reality.
So let’s look at price and see what it has to say about itself at this now moment in time.
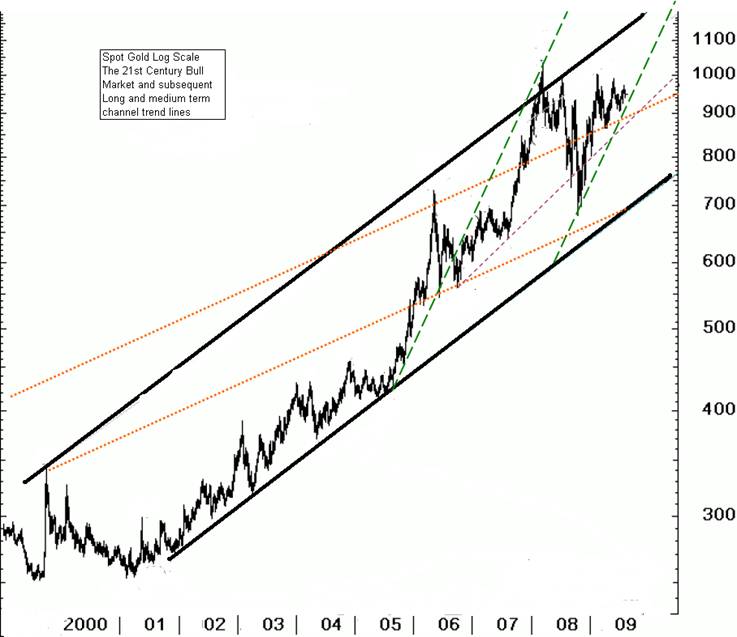
The chart you see below is the entire 21st CENTURY LONG TERM BULL MARKET since it began. It is characterized by a MAIN BLACK CHANNEL that shows gold's price support around $750 and price resistance around $1100. But if you look closer you can see some smaller channel lines that exist within the big black channel. In fact, there are three, the 1999 orange channel, the 2005 green channel and the 2007 purple trend line. Notice how price is just supporting at the green trend line and how the orange and purple lines are in a price area of 850 to 925 at this current time. This is a very important medium term price support area for gold. A breach of the 830 area would suggest that gold's price would return to test the bottom black uptrend channel line at around 750.
Upside potential
Gold has been trading within the green channel parameter lines since 2006, and as long as gold remains above the 925 area, this channel will be intact and prices will be poised to MOVE HIGHER into a MAJOR BREAKOUT above the top black channel line and the major bull market uptrend will resume this fall.

However, should price break below the green line channel, and begin to support within the orange and purple trend lines, it will be suggestive that gold's consolidation is not yet complete and we will remain trading range bound between 1000 and 880 for a little while longer, perhaps into the October or November time frame. For while the seasonal uptrend in gold usually begins now, it can extend in some years into late fall.
The final scenario discussed earlier in this chart is if gold breaks below all the dotted lines and below 830 in price. Then the "odds" would favor a test of the lower black line at 750. All it would take is another contraction like we had last fall.........err......I mean, last autumn.
So the long term price support for gold is 925, 900, 865-880, and 750.
Let’s now ZOOM in closer and see what price is showing right now to see what we can discern as to its current directional outcome.

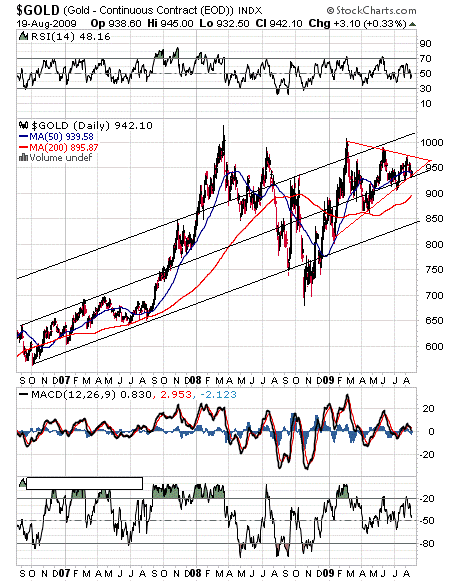
If I can direct your attention to the MIDDLE black channel line. Notice it is connected to the price tops of the 2006-2007 winter rally and if you follow it all the way to today, you can see how price has been hanging on and supporting right on that 3 year trend line since June. The 50 day moving average is right there as well and the 200 day moving average is at the 900 area. (As of Friday Aug 28th).
On a shorter term basis then should gold drop below the 923-930 area, it would suggest a test of the 850 to 900 area in the coming month.
On the UPSIDE, any move above the down trending red line above 975 would open the door for a test of the 1025 area. Any move above 1075-1100 would be considered A MAJOR BREAKOUT IN PRICE.
The parameters for September suggest that moves above 975 would tilt the ODDS in favor of a rally in the triple digits. The inverse would be a close below 925 would tilt the ODDS in favor of a drop into the 850 to 900 area.
Finally, let's ZOOM in and see what the trend looks like underneath the daily price bars on the charts.
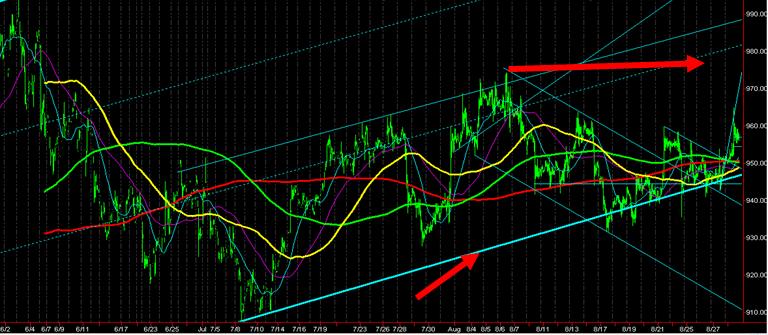
Below is an hourly chart of December gold. The small red arrow at the bottom is pointing to an aqua colored trend channel line. This channel line is the 2009 trend line. Look at how the gold price has been bouncing off of this line time after time since August 7th. In an amazing DISPLAY gold has fought off each and every bear attempt to push it thru and break down in price. But gold has withstood 10 tests and probes and each and every time has bounced right back above that line. Finally last Friday, gold rallied from the 949 area to 965 before pulling back to close the week out at 955.
Now gold is poised to challenge the last two interim highs at 960 and if gold can climb above the 978 area where the long red arrow is pointing, then gold has the potential to launch into a fall rally and reenter the triple digit price area. On the inverse, should gold fall below the aqua channel line, and close below 925, then we would expect gold to correct towards the 900 area or lower and potentially postpone the fall rally.

BOTTOM LINE:
The bottom line is one way or another, the odds greatly suggest that a big move is about to develop in the gold market and the direction is about to be established.
My market strategy is not to try and guess where the market is going. There are plenty of applicants for that function already in market land. You probably know many already. I find that it is a lot easier to let gold itself lead the way. And when gold supports and then establishes a trend and begins to move, I FOLLOW IT. As you can see by the charts, the next trend is about to begin. In six of the last 8 years, gold has launched a 4th quarter rally. This report has shown the technical price areas gold needs to hold in order to fulfill its rally potential.
At Goldtrends, we follow all the timeframes of the gold market right down to the hourly trend. We are currently awaiting the arrival of the fall rally. Gold has established the PRICE points at which the "odds" will tilt to the upside or the downside. If you like to follow along with us as we watch PRICE confirm when the next major trend begins, then drop by the website (where registration is not required) and check out ALL of the gold and silver analysis provided there for your review.
May you prosper in the coming year........
Bill
Bill Downey is an independent investor/ trader who has been involved with the study of the Gold and Silver markets since the mid 1980’s. He writes articles for public distribution for other newsletters and websites as well as his own free site at: http://www.goldtrends.net/Email: Goldtrends@gmail.com
© Copyright Bill Downey 2009
Disclaimer - The opinion expressed in this report is the opinion of the author. The information provided was researched carefully, but we cannot guarantee its total accuracy. The report is published for general information and does not address or have purpose or regard to advise specific investments to anyone in the general public. It does not recommend any specific investment advice to anyone.
© 2005-2022 http://www.MarketOracle.co.uk - The Market Oracle is a FREE Daily Financial Markets Analysis & Forecasting online publication.


