


Stock Markets Turning Lower
Stock-Markets / Financial Markets 2009 Sep 02, 2009 - 03:42 AM GMTBy: Frederic_Simons

 In our last newsletter, we have been reflecting about the possibility of a nearing turning point in the markets. Yesterday, the stock market declined on significant volume despite good economic news. This is definitely no good news for bulls. Having breached the red sell line on the longer term charts, stock markets tumbled lower.
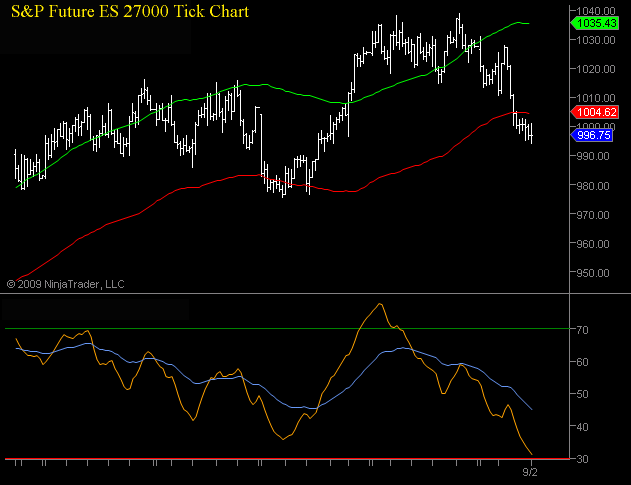
The following charts illustrate the present chart picture in the stock markets:
[Please click here for additional information about the trading system and how to read the charts]
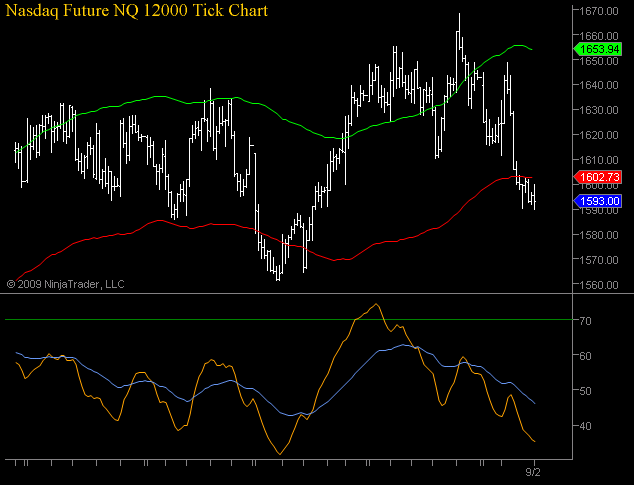
These charts show that the ES and NQ are currently on a bearish sell signal, with the path of least resistance pointing to the downside.
We are well aware of the fact that the last sell signal proved to be a "bear trap" in hindsight, but this does not change our bearish view because of the current sell signal. In fact, a lot of analysts and traders have become overwhelmingly longterm bullish, saying that the "recession is over". Likewise, we would not be surprised if analysts would come out now and say that a "healthy pullback" was good for the stock market. We will not be buyers before the long term chart turns bullish again, it this would be the case only if NQ traded above 1654 and ES above 1035.
We actually see the danger that buying on a dip - a strategy that was profitable during the last 6 months - will not be profitable in the next 6 months (at least), as the downmove in the stockmarket that started yesterday might well turn out to be the next significant bear-market downleg. We are not afraid to "miss out" on another upmove, as we would be buyers again on significant strength near the recent highs, if and when prices trade above the green buy line again. But not earlier.
The longer term charts for US Treasury Bonds still show a bullish picture, similar to what we observed in our last update. Yesterday, the Bonds sold off briefly when economic data came out, be recovered their losses until the end of the day, closing about 0.2 per cent in positive territory.
Having said this, we are not particularly impressed by the performance in the treasury market, especially with regard to the long end of the curve. 5 year treasuries were much stronger yesterday in comparison.
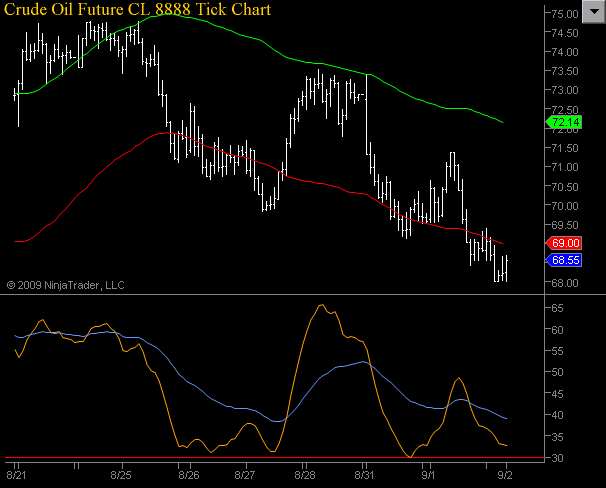
Looking at commodities and currencies, yesterday offered some interesting price action. While the US Dollar strenghtened significantly (we had noticed here the inability of EUR/USD to close above 1.44), commodities did not behave in exactly the same way one would ordinarily expect. Crude oil sold off significantly, trading at around 68 USD currently, and mirroring the activity in the declining EUR/USD exchange rate.
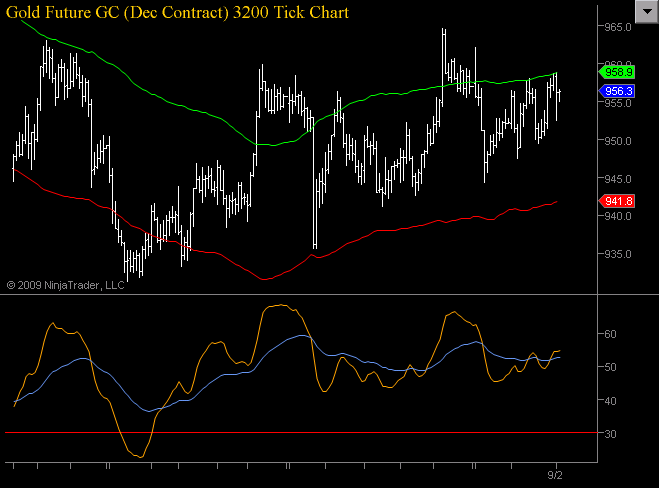
In contrast, Gold futures - often considered to be an "anti-US Dollar trade" - remained remarkably resiliant, and Gold was actually able to rise despite the weak stock market, weak oil and a strong US Dollar.
This should not be taken lightly. Instead, we might see early stages of a breakdown of the correlation between the US Dollar and Gold. This would not surprise us fundamentally as (i) the notion of gold being an "anti-US Dollar trade" has become so widespread that Mr. Market can hurt a lot of people with their pants down, and (ii) because the problems arising from debt-financed "stimulus" packages and fiat currencies are not limited to the United States, but can be attributed to all G 7 countries collectively.
The current "decoupling" of Gold may be the first sign of a second wave up in Gold, that will mark an increase of its value in absolute terms, i.e. against all fiat currencies. Until our triangle formation in Gold is not broken to the upside however, this presumption will not be confirmed.
We have to confess we are a little concerned about the fact that even Bloomberg reports about this triangle formation in Gold. (click here for the analysis). Even though this pattern is not invalidated if more people are watching it, it is obvious that this might lead to more volatility and "false signals/breakouts" on the one hand, but lead to an even stronger trend on the other hand after a breakout has finally occured.
Currently, Gold is holding up remarkably, and we will see if any move in the metal has legs. We will certainly not argue with the trend, if it is up or eventually down.
If you have any questions, please do not hesitate to contact us by writing an email to

By Frederic Simons
http://www.crossroadsfx.hostoi.com
© 2009 Copyright Frederic Simons - All Rights Reserved
Disclaimer: The above is a matter of opinion provided for general information purposes only and is not intended as investment advice. Information and analysis above are derived from sources and utilising methods believed to be reliable, but we cannot accept responsibility for any losses you may incur as a result of this analysis. Individuals should consult with their personal financial advisors.
© 2005-2022 http://www.MarketOracle.co.uk - The Market Oracle is a FREE Daily Financial Markets Analysis & Forecasting online publication.