


Five More Banks Go Bust, Stocks Retrace as Gold Breaks Out
Stock-Markets / Financial Markets 2009 Sep 05, 2009 - 01:53 PM GMT

 Five more failed banks!
These are taken from the FDIC Failed Bank List. No further comment is necessary.
These are taken from the FDIC Failed Bank List. No further comment is necessary.
Unemployment high, working hours low.
Employers kept Americans’ working hours near a record low in August, signaling that economic growth is poised to reward companies with added profits while postponing any recovery in the job market.
The average workweek held at 33.1 hours, six minutes from the 33 hours in June that was the lowest since records began in 1964, the Labor Department said yesterday. The report also showed that while payrolls fell by the least since August 2008, the unemployment rate rose to a 26-year high of 9.7 percent. The numbers have been gamed so badly at the BLS that it may be estimated that the real unemployment number could be a million more than estimated.
The VIX is pushed back to its base.
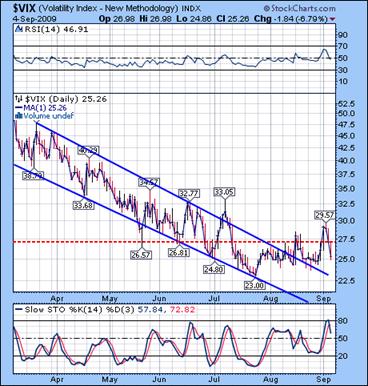
--The VIX was pushed back to its base below Critical Support/Resistance at 27.28. This action may be likened to a coiled spring that will have to release its energy very soon. The delaying action may have the effect of a much stronger release when it finally happens. The target for the VIX is its November 2008 high of 89.53. Think of that in relation to what equities were doing during that same period. This indicator is getting no respect at the moment, but may be warning us that something serious is afoot.
The SPX retraces.
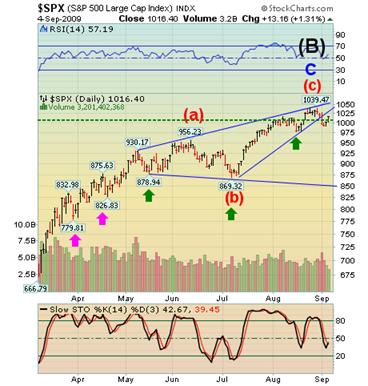
--The SPX retraced 50% of its decline from last Friday’s high and now has a reversal pattern in place n the daily chart. Critical Support is at 1006, which held the SPX in check for two days before breaking above. Trading volume on Friday was listless and diminished during the day while the market went higher into the close on program trading.
The NDX retraces.
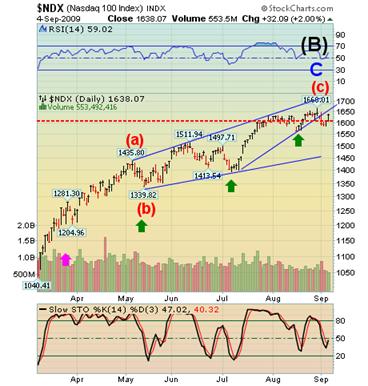 --The NDX retraced 61.8% of its decline back to the underside of its trendline. It held below Critical Support/Resistance at 1611 until Friday, when it broke above it. It, too, has a reversal pattern now on the daily chart.
GLD broke out of its symmetrical triangle.
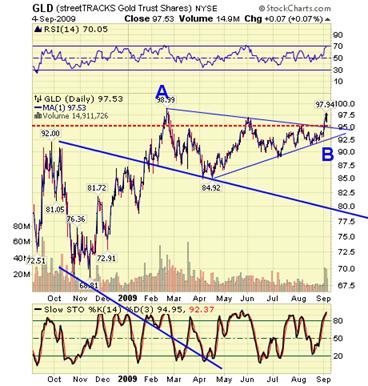
-- GLD rallied above its symmetrical triangle and Critical Support Friday at 95.47. I remain bullish as long as it stays above Critical Support. The next hurdle is a massive head and shoulders neckline just above 98. However, GLD is overbought and may need a little more of a pullback before attacking that obstacle. An overbought condition, on the other hand can be maintained in a “melt-up” situation, where panic buying takes place due to unusual circumstances. The only thing that comes to mind is the state of the Shanghai Index, which I will discuss later.
USO broke uptrend support.
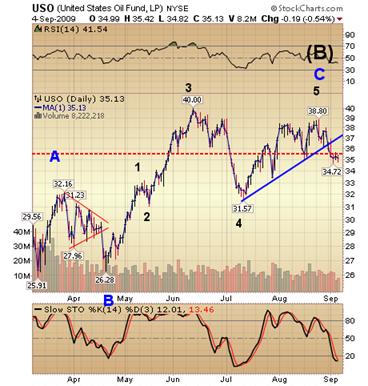
-USO broke its trendline this week and is headed for further declines below Critical Resistance at 35.50. The pattern suggests a couple more subdivisions lower before downside profits may be taken.
Introducing the Financial Index (ETF).
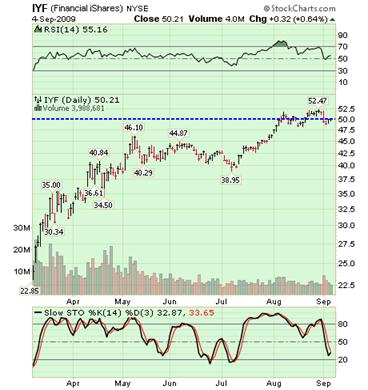
IYF has also presented us with a reversal pattern and a very tight stop from Critical Support/Resistance at 50.25. The divergences in RSI and the Slow Stochastics support the thesis that the final top is in and the pattern itself calls for a third wave (of a smaller degree) next on the agenda for IYF.
Introducing the Shanghai Index ETF.
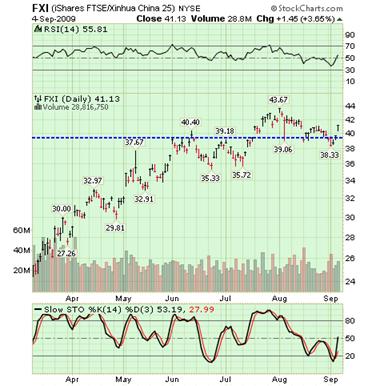
While the Shanghai Index has already been testing bear market territory, the FXI has had about half of the Shanghai Index decline. This three-day weekend gives us some issues with this ETF, since there is a reversal pattern and the Shanghai market will have been open for two days before ours reopens on Tuesday.
TLT tests its neckline support.
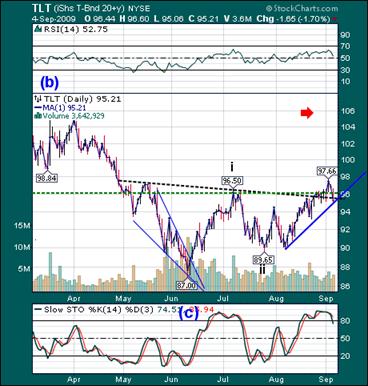
-- TLT retested its neckline Friday. Critical Support is at 96.29 and you can see that it closed just below it. That action gave us a breakeven week in the Long Bond. I have adjusted the trendline to monitor its progress, as I had suggested earlier. Although the neckline was challenged, it held, so the probabilities are high that a resumption of the rally will develop on Tuesday.
Change this ETF’s name to Rodney Dangerfield.
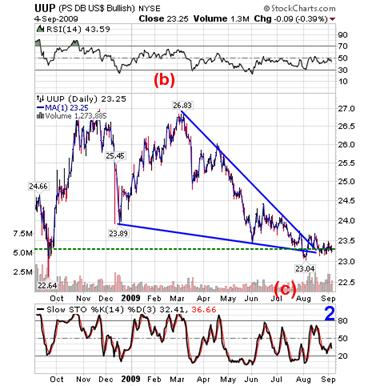
--UUP closed below Critical Support at 23.31 on Friday.
I am still bullish against 23.04. Bullish wedges tend to be fully retraced, so I expect a strong rally to develop in UUP.
In summary, wedges triangles and broadening tops are all coiling actions that are building up to strengthen the next move. It is obvious that their reversals may be delayed, but that just tightens the spring for a greater push back when it breaks out. I hope you all have a relaxing weekend!
Regards,
Tony
Our Investment Advisor Registration is on the Web
We are in the process of updating our website at www.thepracticalinvestor.com to have more information on our services. Log on and click on Advisor Registration to get more details.
If you are a client or wish to become one, please make an appointment to discuss our investment strategies by calling Connie or Tony at (517) 699-1554, ext 10 or 11. Or e-mail us at tpi@thepracticalinvestor.com .
Anthony M. Cherniawski,
President and CIO
http://www.thepracticalinvestor.com
As a State Registered Investment Advisor, The Practical Investor (TPI) manages private client investment portfolios using a proprietary investment strategy created by Chief Investment Officer Tony Cherniawski. Throughout 2000-01, when many investors felt the pain of double digit market losses, TPI successfully navigated the choppy investment waters, creating a profit for our private investment clients. With a focus on preserving assets and capitalizing on opportunities, TPI clients benefited greatly from the TPI strategies, allowing them to stay on track with their life goals
Disclaimer: The content in this article is written for educational and informational purposes only. There is no offer or recommendation to buy or sell any security and no information contained here should be interpreted or construed as investment advice. Do you own due diligence as the information in this article is the opinion of Anthony M. Cherniawski and subject to change without notice.
Anthony M. Cherniawski Archive |
© 2005-2022 http://www.MarketOracle.co.uk - The Market Oracle is a FREE Daily Financial Markets Analysis & Forecasting online publication.