


Natural Gas Bottoming, Gold and Crude Oil Breakout
Commodities / Commodities Trading Sep 10, 2009 - 01:14 AM GMTBy: Chris_Vermeulen

 How to trade hot commodities like natural gas, oil and gold – We should see big moves in the coming weeks as gas bottoms, and oil & gold breakout or breakdown. A lot of money is going to be exchanging hands quickly and the key is to be on the receiving end of things. Below are some charts showing where these commodities are trading.
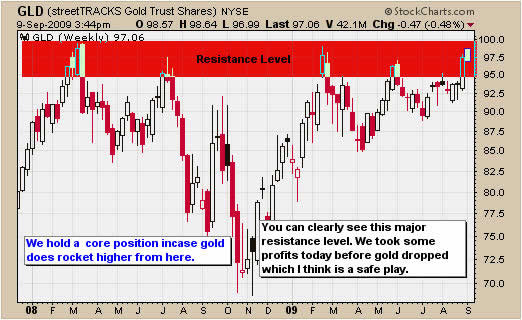
How to Trade Gold – Weekly Chart
How I trade gold is relatively straight forward. I use a simple trading model which allows me to identify the down side risk for a potential gold trade. I also use the same model for trading oil, gas and silver.
Beyond finding good entry points, it is crucial to know when to take some profits off the table. The weekly gold chart clearly shows gold trading at a resistance level which means there are going to be more sellers than buyers, hence the reason it is called resistance.
To trade gold I enter with my low risk entry points and sell half my position once I reach a resistance level. Today for example gold moved up into this long term resistance level and then started to head south. We took some profits off the table before gold dipped in the late afternoon for a healthy gain. Taking profits is a must or you’ll simply hold onto winning positions until they eventually turn into a loser.
Gold Newsletter
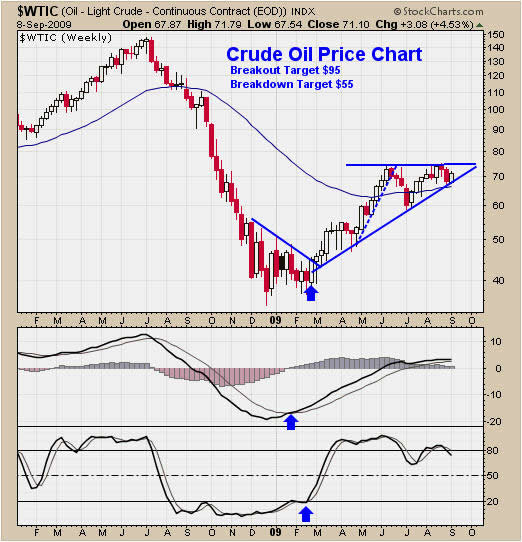
How to Trade Crude Oil – Weekly Chart
Trading crude oil is exciting because it moves much faster than gold. How to trade crude oil with low risk can be done by using my simple trading model which is a combination of indicators like momentum, support & resistance, volume, price patterns and media coverage. All these things combined allow for highly accurate trades with minimal down side risk.
Crude oil looks ready to make a big move. The odds are pointing to higher prices because oil has a multi month bullish price action and the falling US dollar helps increase the price of oil. I can see oil breakout and rally into the $95 per barrel level if things go that way in the coming weeks.
How To Trade Crude Oil Breakout
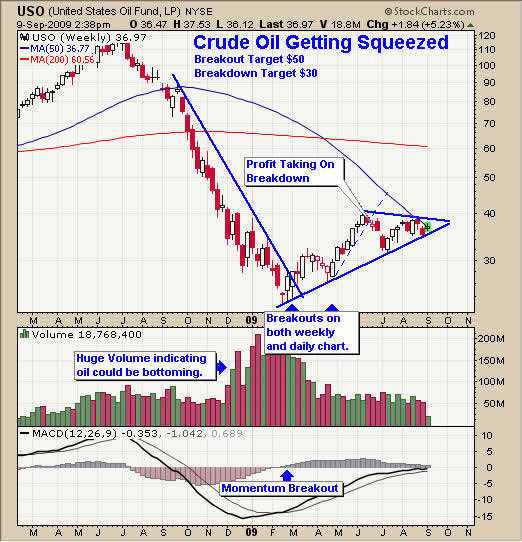
How to Trade Oil (USO Fund) – Weekly Chart
USO tracks similarly to the price of crude oil and it provides some great trades for both swing traders and day traders. I focus on trades that bounce off support with low downside risks, which occur on both the daily and weekly charts.
How to Trade Oil
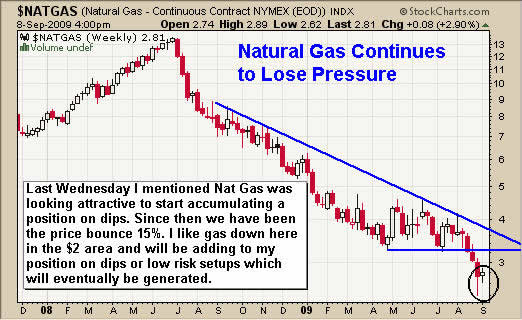
How to Trade Natural Gas – Weekly Chart
Natural gas is looking ready to bottom here. If you go back to the early 90’s the $2-3 range is a major support level. While I don’t generally try to pick bottoms, there are some signature price patterns and volume patterns that have proven to be very profitable for catching sharp bounces.
How to trade Natural Gas
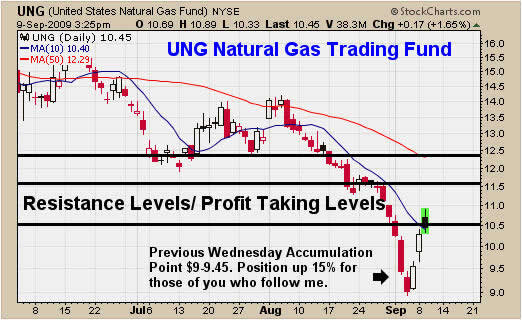
How to Trade Natural Gas – Daily Chart
The daily chart shows a perfect waterfall sell off with the price of natural gas dropping to a long term support level. This pattern combination shows panic selling which indicates a short term bottom is close.
The extreme panic selling and sharp decline in price, removes much of the down side risk. Scaling into a position over a few days, if the price continues to move lower, is important for this strategy to work its magic.
The black horizontal lines show my resistance levels for taking profits. If the price were to drop below $10 then I would exit the second half of the position to lock in the rest of the profit.
How to Trade UNG
How to Trade Commodities Conclusion:
Trading commodities is very simple with all the ETF’s and funds available. The energy funds like oil and gas have some issues with following the prices of their underlying commodity but I do not find it a problem with my style of trading.
I would really like to know the entire story about what is going on with the oil and nat gas funds which have crazy contango issues??? Why do other commodity funds like GLD (gold bullion) and SLV (silver bullion) not have these issues?? Why can’t they make a fund which follows oil and gas properly? All I know is that there are a lot of dishonest people in the financial industry taking honest hard working peoples money.
If you would like to receive my free weekly trading reports visit this webpage to join my newsletter: www.GoldAndOilGuy.com
I will be sending out my energy report for oil and natural gas tomorrow. If you would like to receive my trading reports please visit my website at: www.GoldAndOilGuy.com
Hello, I'm Chris Vermeulen founder of TheGoldAndOilGuy and NOW is YOUR Opportunity to start trading GOLD, SILVER & OIL for BIG PROFITS. Let me help you get started.
If you would like more information on my trading model or to receive my Free Weekly Trading Reports - Click Here
If you have any questions please feel free to send me an email. My passion is to help others and for us all to make money together with little down side risk.
To Your Financial Success,
By Chris Vermeulen
Chris@TheGoldAndOilGuy.com
Please visit my website for more information. http://www.TheGoldAndOilGuy.com
Chris Vermeulen is Founder of the popular trading site TheGoldAndOilGuy.com. There he shares his highly successful, low-risk trading method. For 6 years Chris has been a leader in teaching others to skillfully trade in gold, oil, and silver in both bull and bear markets. Subscribers to his service depend on Chris' uniquely consistent investment opportunities that carry exceptionally low risk and high return.
This article is intended solely for information purposes. The opinions are those of the author only. Please conduct further research and consult your financial advisor before making any investment/trading decision. No responsibility can be accepted for losses that may result as a consequence of trading on the basis of this analysis.
Chris Vermeulen Archive |
© 2005-2022 http://www.MarketOracle.co.uk - The Market Oracle is a FREE Daily Financial Markets Analysis & Forecasting online publication.