Stock Index Trading Position 50% Short
Stock-Markets / Stock Index Trading Sep 14, 2009 - 01:56 AM GMTBy: Angelo_Campione
 SPY: Short 50%
QQQQ: Short 50%
General Commentary:

Well, you've got to hand it to them, the markets are doing a great job in giving the appearance that it's blue sky ahead, we hit new highs this past week and the trend is clearly pointing higher. Having said that, we remain unconvinced that all is well and a turn lower is not far away.
I've said it many times that the market loves to do the opposite of what's expected, and who knows, maybe this is one of life's little ironies that's necessary to add some spice to our existence!
I don't know about that, what I do know is that I'm not buying this move higher, it has suspicion written all over it. It may turn out that we do go higher as the fear of missing the gains rises but the probabilities that prices will be lower over the next few months is growing.
Being Patient (and remaining short) is likely to be rewarded in the not too distant future. I know it's not easy being against the crowd but we'll stick with the system.
On to the analysis..
SPX Chart - Bigger Picture
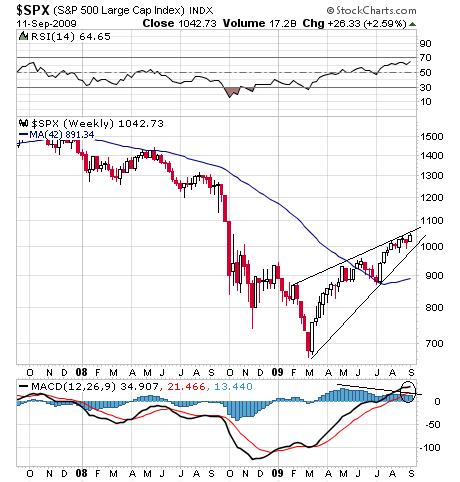
Looks like it won't be too long now before the rising wedge pattern we've discussed in past weeks breaks. Chances favor that the break will be to the downside, note the negative divergence on the MACD histogram, also note the short term line on the linear MACD is potentially getting ready to cross lower.
SPX Chart - Shorter Picture
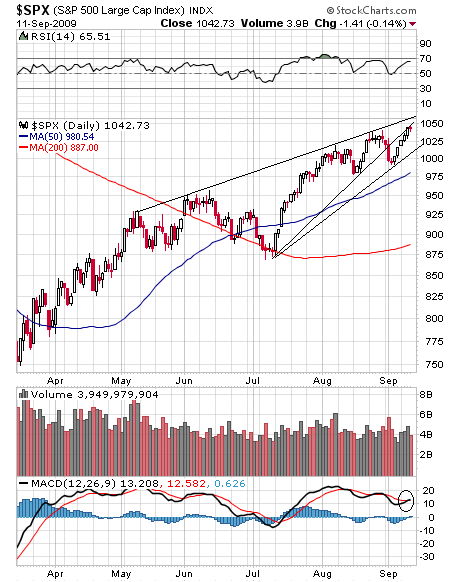
The shorter term shows the rise of this past week now meeting resistance at the previous mini rising wedge line. The linear MACD has now crossed and shows the potential for a continuation of the bullishness into options expiration week.
Options expiration weeks usually have a bullish bias but it's not looking as though there'll be any significant upside here, there's still substantial resistance above and the market seems to be setting up for a drop in the near term. We could still nudge higher this week, although the 1060 region is likely to contain the move at this point.
For the week ahead, support on the SPX is 1000 - 1015 and resistance is at 1050 - 1060.
NDX Chart - Shorter Picture
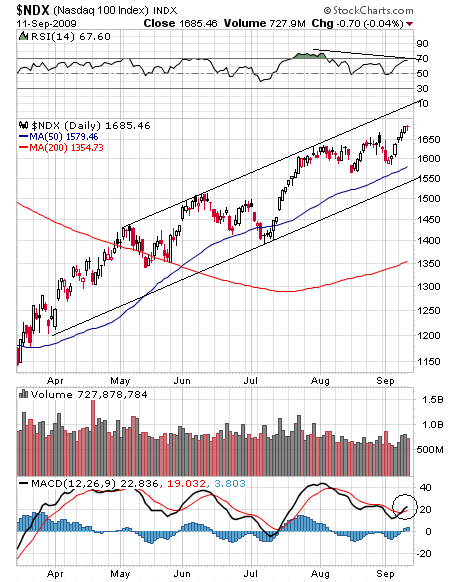
The Nasdaq remains in an impressive uptrend and also made new 2009 highs this past week. The internals are still relatively weak although, which means we need to remain wary of these moves higher. Also note the potential negative divergence on the RSI.
The MACD has turned bullish here and could be indicating a continuation of the move higher with the general positiveness behind options expiry week. If you are long here, keep your stops tight.
For the week ahead, support on the NDX is at 1650 and resistance is at 1690 - 1700
The VIX Picture
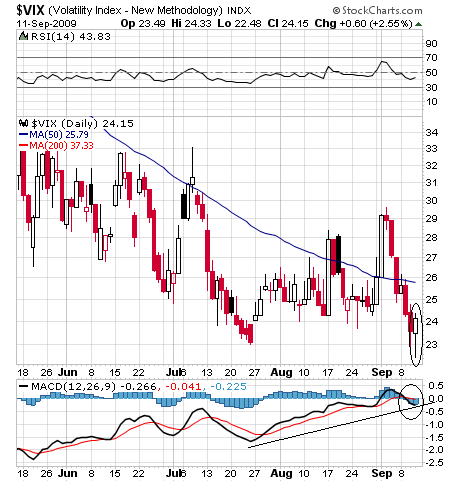
The VIX has fallen back to support but the internals haven't deteriorated significantly, which means be wary of the market bullishness.
If the linear MACD crosses higher again, we'll be seeing divergence that'll add to the dark clouds that are hovering around the markets. It looks as though we're in for an interesting week.
The VIX measures the premiums investors are willing to pay for option contracts and is essentially a measure of fear i.e. the higher the VIX, the higher the fear in the market place. It tends to move inversely with the markets.
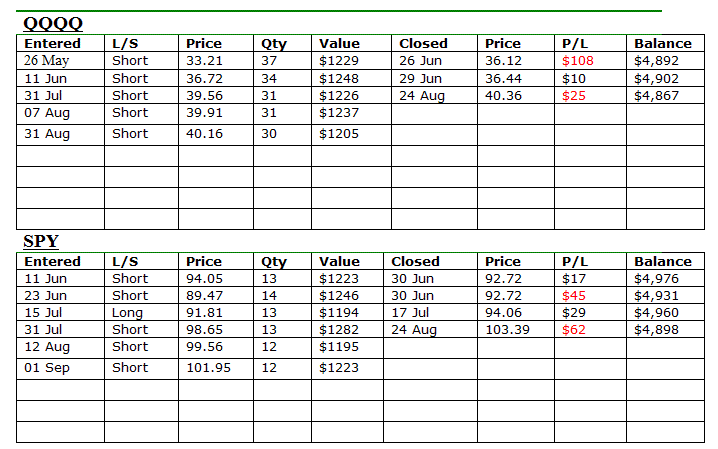
Performance
We're using a starting capital of $5,000 for each market and allocations are based on 25% of this or the remaining balance.
Quote of the Week:
The quote this week is from Albert Schweitzer, "An optimist is a person who sees a green light everywhere, while the pessimist sees only the red stoplight... the truly wise person is colorblind."
Feel free to email me at angelo@stockbarometer.com if you have any questions or comments.
If you are receiving these alerts on a free trial, you have access to all of our previous articles and recommendations by clicking here. If you do not recall your username and/or password, please email us at customersupport@stockbarometer.com. If you are interested in continuing to receive our service after your free trial, please click here.
By Angelo Campione
Important Disclosure
Futures, Options, Mutual Fund, ETF and Equity trading have large potential rewards, but also large potential risk. You must be aware of the risks and be willing to accept them in order to invest in these markets. Don't trade with money you can't afford to lose. This is neither a solicitation nor an offer to buy/sell Futures, Options, Mutual Funds or Equities. No representation is being made that any account will or is likely to achieve profits or losses similar to those discussed on this Web site. The past performance of any trading system or methodology is not necessarily indicative of future results.
Performance results are hypothetical. Hypothetical or simulated performance results have certain inherent limitations. Unlike an actual performance record, simulated results do not represent actual trading. Also, since the trades have not actually been executed, the results may have under- or over-compensated for the impact, if any, of certain market factors, such as a lack of liquidity. Simulated trading programs in general are also subject to the fact that they are designed with the benefit of hindsight. No representation is being made that any account will or is likely to achieve profits or losses similar to those shown.
Investment Research Group and all individuals affiliated with Investment Research Group assume no responsibilities for your trading and investment results.
Investment Research Group (IRG), as a publisher of a financial newsletter of general and regular circulation, cannot tender individual investment advice. Only a registered broker or investment adviser may advise you individually on the suitability and performance of your portfolio or specific investments.
In making any investment decision, you will rely solely on your own review and examination of the fact and records relating to such investments. Past performance of our recommendations is not an indication of future performance. The publisher shall have no liability of whatever nature in respect of any claims, damages, loss, or expense arising out of or in connection with the reliance by you on the contents of our Web site, any promotion, published material, alert, or update.
For a complete understanding of the risks associated with trading, see our Risk Disclosure.
© 2009 Copyright Angelo Campione - All Rights Reserved
Disclaimer: The above is a matter of opinion provided for general information purposes only and is not intended as investment advice. Information and analysis above are derived from sources and utilising methods believed to be reliable, but we cannot accept responsibility for any losses you may incur as a result of this analysis. Individuals should consult with their personal financial advisors.
© 2005-2022 http://www.MarketOracle.co.uk - The Market Oracle is a FREE Daily Financial Markets Analysis & Forecasting online publication.


