


Australian Gold Stocks, Diary of a Short-Term Trade & Fundamental Application
Commodities / Gold & Silver Stocks Sep 15, 2009 - 07:52 AM GMTBy: Neil_Charnock

 Introduction - This article is for traders and investors (non traders) alike. Readers that know my work know that I use technical indicators for exit and entry points, however only after I like the fundamental picture in a stock or commodity.
My GoldOz Members received access to an educational file analyzing the stock at the centre of the illustration trade in this report a few weeks back. Members also would have seen the obvious parallel I used when comparing this company to one other stock which also went up nearly 50% since I posted that report.
This analysis was also provided in a Fundamental analysis file released a few weeks earlier in the GoldOz Gold Members area which covered the whole sector and is still on the site.
This latest file “escaped” to several other blog sites and was passed around the net as I also used it as a promotional file. Here is the link to this free educational report if you are interested. I am working at the next file of this type to be released before the end of September or soon after.
Profitable Investing
Knowing the immediate direction or future direction of a stock and then trading within that trend can amplify profits substantially.
The general idea is to trade the stock either longer or short-term by selling into price peaks and then buying back additional shares, with your initial capital plus newly locked in profit, on the subsequent fall.
The original parcel of shares swells with each successful trade but the original choice of stock was made on fundamental grounds. Therefore I am truly using both disciplines side by side as investment tools.
This article contains theory that can be used by all investors and traders. True understanding of this simple principle can enable you to earn spectacular gains.
Before you say – “but I am not a trader” - think again. The difference is just a matter of time zones. I am comparing the intra-day chart using 15 minute time intervals to daily and weekly charts to show the same pattern used successfully to invest in gold stocks. Normal investors (non traders) can use this to their benefit for longer term trading.
The magic thing here is that you can use exactly the same techniques for day trading, short term swing trading (1 – 12 weeks) and finally up to 12 – 36 month longer term investments.
This is also educational report on fractal analysis if you want or need to put a name to this theory. Before you get scared of a word that is not defined let me quickly explain before I start. The term "fractal" was coined by Benoît Mandelbrot in 1975 and was derived from the Latin “fractus” meaning "broken" or "fractured." Any trend proceeds in a “broken” manner and not in a straight line.
Fractals can be found in nature - charts too and there are all sorts of useful applications. The application I am also using and referring to in this essay is to compare completely different time zone views to the simplified technical analysis techniques I use to trade shares.
I started this article a few days back so I will leave the chart below as it was and also add an updated chart below it to show the successful completion of this real trade to this point.
This is an ongoing process I continue to use with various equities but one important fact – the stock must be trading with significant volume or the technicals become more unreliable as volume decreases. The rule is; “higher the volume the better” when it comes to technical analysis application.
OK looking at the chart below we see the entry point of the trade based on support levels in the “Mystery Stock Daily chart” later in this article and also the crossover point on the MACD in the chart directly below.
The stock was mainly trading in a range between 2.5 and 3.2 after a spike early in 2009 and I took the view the deeper levels were in probability unlikely to be probed again.
Successive trades were layered in below at 2.6 after I posted a positive educational report that used the stock as an example of valuation based on fundamental factors. I still wanted to add to positions but posted the article anyway which is an ethical point. I would not have posted a positive report before I was set in my position if I wanted to pump and dump.
I put my money where my mouth was and continued to buy as I was delighted to see some more selling over the coming few days. Note: I also disclosed ownership of the stock as required by ethical and regulatory standards. Here is the 10 day 15 minute time interval chart.
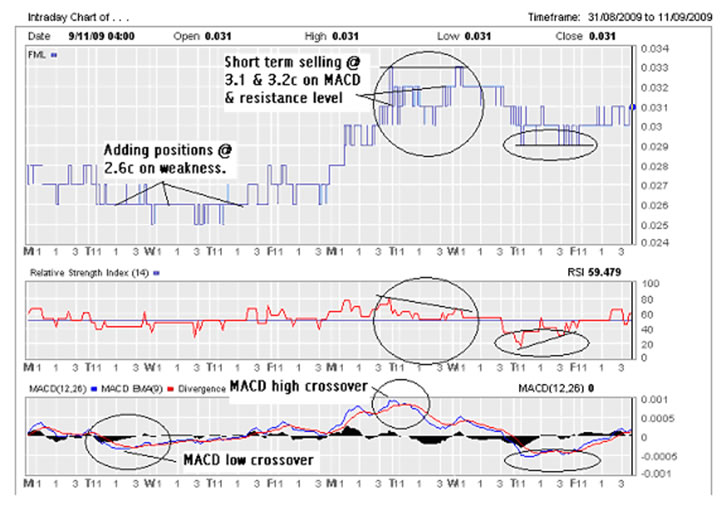
See above where the MACD low crossover signal was made – a buy or add point. The subsequent profit point was up at the resistance level @ 3.2 / 3.3 see daily chart (last chart).
Even though I believed it would blast through this high I did fell it would have to do some work first – so I watched for confirmation. Sure enough a classic negative divergence sell signal emerged as shown in the circles around the mid chart area above. Look at these patterns they are a fractal – this pattern is a fractal because it emerges on a weekly basis, daily basis and intra day. The pattern: two price tops either at the same level or the second peak is higher – and the corresponding RSI peaks have a lower second peak.
Selling was completed on the basis of the high MACD crossover (circle on chart above) and the negative price to RSI divergence marked with the straight lines within the circles. The re-entry buy point came in two days later at 2.9 and 3 based on the positive divergence (price to RSI divergence which is an exact reverse of the sell signal described above) which got filled. This entry point is shown in the top two ellipses in the chart above on the far right hand side.
Now let us take a look at the updated chart directly below to see what happened next…

Subsequent to the re-entry point we saw a matching pattern within the ellipses – how often they occur. This told me the trade was under control. I marked both RSI and price with ellipses on the chart above to show how similar the patterns were.
Next action – “BINGO” – a 9 point pop (rise) up to 3.8 where the shares were sold at 3.7. This may or may not be the top but who cares because a new entry point will arise. It would be hard to go broke locking in 25% profits on top of 20%+ profits within a two seek period.
More information is available in the Gold Members section of GoldOz – subscribe today if you want additional fundamental and technical coverage on the Australian gold stocks. The rest of this article is for GoldOz Gold Members only…
Good trading / investing.
Regards,
Neil Charnock
GoldOz is currently developing a Member area and has added further resources for free access. We have stepped up our research and stand by to assist investors from all walks of life. We sell an updating PDF service on ASX gold stocks from only $AUD35 for 3 months – the feedback is grateful and enthusiastic because we are highlighting companies that have growth potential and offering professional coverage of the sector. GoldOz web site is a growing dynamic resource for investors interested in PGE, silver and gold companies listed in Australia , brokers, bullion dealers and other services.
Neil Charnock is not a registered investment advisor. He is a private investor who, in addition to his essay publication offerings, has now assembled a highly experienced panel to assist in the presentation of various research information services. The opinions and statements made in the above publication are the result of extensive research and are believed to be accurate and from reliable sources. The contents are his current opinion only, further more conditions may cause these opinions to change without notice. The insights herein published are made solely for international and educational purposes. The contents in this publication are not to be construed as solicitation or recommendation to be used for formulation of investment decisions in any type of market whatsoever. WARNING share market investment or speculation is a high risk activity. Investors enter such activity at their own risk and must conduct their own due diligence to research and verify all aspects of any investment decision, if necessary seeking competent professional assistance.
Neil Charnock Archive |
© 2005-2022 http://www.MarketOracle.co.uk - The Market Oracle is a FREE Daily Financial Markets Analysis & Forecasting online publication.