Stock Market Investing, Not a Time for Buy and Hold
Stock-Markets / Investing 2009 Sep 16, 2009 - 08:02 AM GMTBy: Claus_Vogt
 Many investors are finding that the current situation in the stock market is very difficult to read because the conclusions of different analytical approaches are unusually conflicting. So let’s review the three most important ones and discuss the relevance of each. Then I’ll tell you what I think is the best way to deal with them.
First …
We Have Fundamental Valuations
The most common and seasoned valuation measures are without doubt dividend yields and price-to-earnings ratios (P/Es).
Dividend yield is easy to figure out … and there’s no leeway for interpretation or adjustments whatsoever. Just divide the annual dividend payment by the share price … plain and simple.
Historically, the stock market was a bargain when the dividend yield was 6 percent or higher.
Right now the dividend yield is a paltry 2.8 percent for the Dow Jones Industrial Average, 2.5 percent for the S&P 500 and a miniscule 0.4 percent for the Nasdaq 100.
So according to this time-proven indicator, the stock market has to be rated expensive.
Now, calculating a P/E is not as straightforward as it once was. Back in the day, all analysts based the price-to-earnings ratio on earnings calculated using Generally Accepted Accounting Principles (GAAP).
 |
| To keep the bullish fire lit, Wall Street concocted creative ways to report earnings. |
But during the 1990s, when stocks got ever more expensive, Wall Street analysts came up with new earnings concepts allowing them to stay bullish. And they tended to adjust reported earnings arbitrarily.
In my opinion, GAAP earnings are the best way to get a proper picture of what’s going on. And the SEC agrees. The Sarbanes-Oxley Act of October 2002 requires public companies to always include a GAAP financial measure.
So I recommend sticking with GAAP earnings. And I also recommend using them on a twelve-month trailing basis instead of relying on ever-optimistic Wall Street estimates.
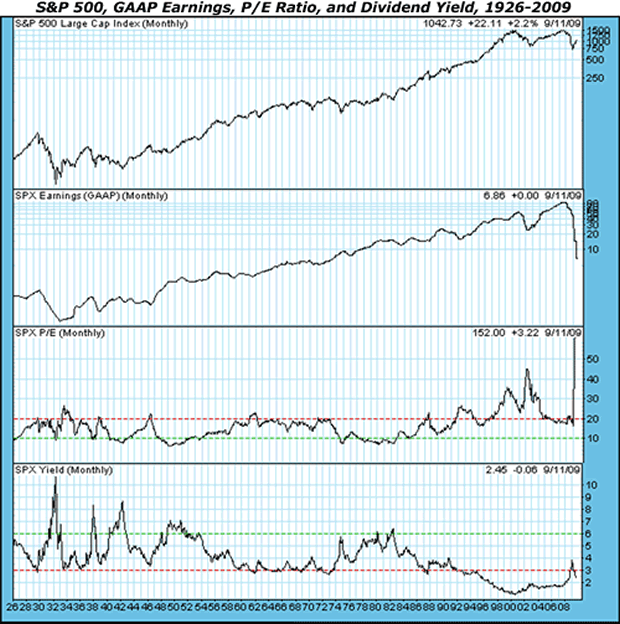
The normal historical range for the GAAP P/E is less than 10 (undervalued) to 20 (overvalued). The current figure is 137 … a record high! So according to this indicator, stocks are extremely overvalued.
And even if we use a non-GAAP earnings measure, like operating earnings, and use forward estimates … the market is now trading at twelve times its two-year forward earnings. The historical mean for the two-year forward multiple is about seven.
Bottom line: Based on the two classic valuation methods, this market definitely does not look cheap.
And remember …
Fundamental Valuations Are Only Long-Term Indicators
Unfortunately, valuation measures tell you nothing about probable stock market returns for the coming year or two. They’re better used for a seven-to ten-year time frame.
In fact, if you rely solely on traditional valuation measures, you’ll be out of the market for many years just waiting for things to get cheap. The chart below shows just how expensive things are right now …

Source: www.decisionpoint.com
This means you have to look at other methodologies, too. Especially if you want to make money over shorter time frames.
So let’s move to another way of looking at the market …
The Macroeconomic Picture Is Somewhat Mixed …
In addition to valuation methods, we have macroeconomic indicators.
Unfortunately the picture they’re currently painting is very dire. The economy is in a post real estate bubble environment. Historically, the after effects of real estate bubbles are not only devastating but last many years. And there’s just no reason to assume that this time should be different.
Look at what’s happening already:
- The banking industry is in shambles … banks are failing faster than any time since the Great Depression. The consumer is over his head in debt and unlikely to go on a buying binge anytime soon. The labor market is depressed without any sign of betterment. Commercial real estate is starting to crack. A new wave of home mortgage credit resets are in the offing. Foreclosures are making new highs as are credit card loan defaults.
- At the same time the government is drowning in red ink.
I could go on and on. But I think you get the picture.
 |
| In spite of all the current problems, two LEIs are rebounding. |
However, there’s one bright spot: Leading economic indicators (LEI). The year-over-year change of the Conference Board’s Index of LEI turned positive in July after hitting a cyclical low of minus 4 percent in March. This is signaling the end of the recession and a bounce.
Another leading economic indicator, the Index of the Economic Cycle Research Institute, has risen even more strongly. It has just registered its strongest rebound since the early 1980s.
Unfortunately these two leading economic indicators do not look very far into the future. Yes, they’re signaling the end of the recession and some kind of a rebound. But they tell us nothing about the durability of the rebound.
It’s very possible that they could reverse direction soon, and that the rebound is nothing more than a flash-in-the-pan made possible by a combination of huge governmental stimulus and the severity of the 2008 slump.
So in the end, I would say macro-economic indicators are mixed at this point. But …
Technical Analysis Yields A Medium-Term Bullish Outlook …
The last way of looking at the stock market is through technical analysis. And here we get a very clear picture …
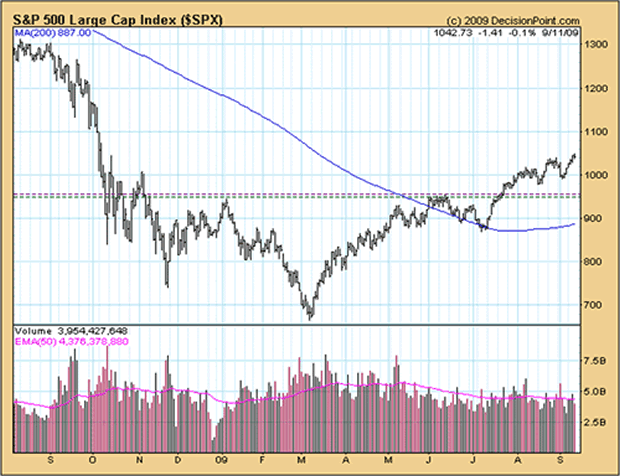
The long-term trend has been down since 2000. But the medium-term trend has clearly turned up this year.
If you look at the chart below, you’ll see a huge bottoming formation of the S&P 500 index starting in November 2008. In July 2009, the index broke above the neckline of this formation signaling a medium-term trend change from down to up and generating a buying signal.
Since then the trend following indicators, like the 200-day moving average and the advance-decline line, have confirmed the medium-term up trend.

Source: www.decisionpoint.com
This shows that a medium term up trend has started. And we should expect a continuation of this trend until evidence of another trend change starts to appear.
So based on the technicals, I see more upside for stocks.
Conclusion: Longer-Term Still Bearish, But Medium-Term I’m Bullish
Bringing all the above together you could draw the following picture for the stock market:
- Valuations are high on a historical basis and a long-term negative, but medium-term they’re meaningless.
- Macroeconomics are longer-term negative or at least doubtful, but medium-term bullish.
- The technical analysis is long-term bearish, but medium-term bullish.
So all in all there’s a rather strong case for a medium-term bullish forecast for the stock market, tempered by a long-term bearish background. This picture should prevent you from getting careless or euphoric and make it clear that there are risks with getting fully invested.
But it also seems to be prudent to consider being partially invested in the stock market to profit from any medium-term surges. You just have to be very flexible and on the lookout for signs of renewed weakness.
This is no time for buy and hold investors. But there are attractive opportunities for medium-term oriented investors willing to buy now and get out on a moment’s notice.
Best wishes,
Claus
This investment news is brought to you by Money and Markets . Money and Markets is a free daily investment newsletter from Martin D. Weiss and Weiss Research analysts offering the latest investing news and financial insights for the stock market, including tips and advice on investing in gold, energy and oil. Dr. Weiss is a leader in the fields of investing, interest rates, financial safety and economic forecasting. To view archives or subscribe, visit http://www.moneyandmarkets.com .
Money and Markets Archive |
© 2005-2022 http://www.MarketOracle.co.uk - The Market Oracle is a FREE Daily Financial Markets Analysis & Forecasting online publication.


