Gold and Silver Analysis - Precious Points : Gold a Threat to the Fiat Currency System
Commodities / Gold & Silver Jun 25, 2007 - 12:20 AM GMTBy: Joe_Nicholson
 “So as we continue to tread water in what was expected to be a period of ennui in the metals markets, we'll continue to monitor key support and resistance levels, as well as moves in the bond markets and trends in the Fed's open market activities.” ~ Precious Points: Enjoy it While it Lasts ?, June 17, 2007
Moving through the 5-day moving averages early in the week was a positive sign, but the brisk pace of repo maturations served as an early warning that conditions had not become extremely bullish. By the end of the week, an additional $10.5 billion dollars of sloshing repo funds came out of circulation this week, but bonds largely remained stable and it was largely a string of bad news out of Wall Street and Washington that created uncertainty and strained the nerves of market participants.
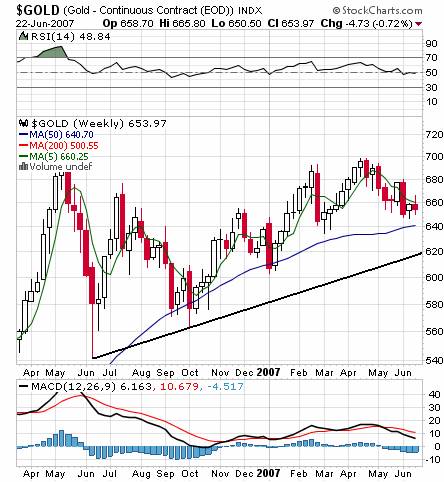
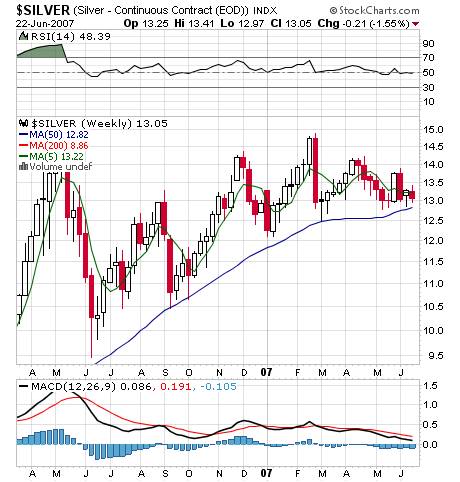
Yet far from signifying the end of the world, the charts below show metals have yet to even significantly test serious support levels since January, and are still up for the year. At this time, $700 gold remains simply too much to escape the spotlight, too great a threat to the fiat currency systems of the world, and would again seriously raise the inflation specter at a time when this could actually be negative for metals. And yet they refuse to go gentle into that goodnight, a testament to their intrinsic value, and their bullish fundamentals. With renewed waves of central bank selling and sluggish TIPS spreads, there is a heated battle to keep the metals down. The convergence of the 5-and 50-day moving averages in silver, as mentioned here previously, suggests the situation will soon be coming to a head.


Last week's update pointed out the now widely recognized fact that the recent move in bond yields was not inflation driven, and even speculated that an increase in inflation now could actually be negative for metals since it would likely cause a further spike in yields. Instead, the move in bonds, not to mention the normalization of the yield curve, was a result of a positive outlook for GDP and the reduction of expectations for a Fed rate cut. The decline in demand for money, as represented by the Fed's sloshing repo funds, during a period of economic optimism may be in large part be a product of the switch from a preference for corporate loans, which can be used for buybacks or virtually any purpose, undertaken while the economic outlook appeared week, to commercial paper issuance, which has recently increased and signals a rebound in capital expenditures related to production.
While markets slipped on quickly rising bond yields, this update was one of the few, if not the only, reminding readers that the Fed couldn't actually hike rates and that a rate cut can't be taken off the table so long as the pace of mortgage defaults continues to increase. Another key economic factor preventing the Fed from raising rates has been the consumer, and this update pointed to retail sales as a guage on the health of the consumer. It wasn't until weak retail and housing data was released this week that the rest of the market awoke to the reality that the Fed is barred from raising rates in the foreseeable future. The Bear Sterns calamity has put the situation all the more in focus.
To a large extent, the brilliance of the Bernanke-era Fed has been the ability to play to both hawks and doves equally well -- essentially, to be all things to everybody. But if anything, the recent history of the markets has been the effects of a cooling in the once intense rate cut expectations. Without at least a nod from the Fed next week that housing and subprime are unquantified and still potentially troublesome factors in the economy, in other words, if a rate hike appears to be inevitable, bond yields will have to move above the overnight rate of 5.25% -- and quickly. On the other hand, if the Fed acknowledges this dilemma and the weaker inflation data (helped by commodities prices last week for sure) this could keep their overall posture in balance and signal a return to the prosperity enjoyed by all markets over the last twelve months. For a while.
If anything, the Fed still wants to raise rates. The global trend is still toward higher interest rates, and inevitably this will manifest here in the U.S. as well. Nothing the Fed says next week, or probably ever, is going to change the fact that foreign countries are going to buy less of our debt in the future, simply because there are better returns elsewhere. Funny how capitalism works, isn't it?
But between here and there is still a huge chasm. Until housing and consumer spending at least stabilize, we can fairly well expect the Fed to stay on hold. As foreign rates increase and the domestic economy on strengthens on the whole, this will lead to new money supply inflation and boom times again for the metals. Essentially, it's a safe bet to expect the Fed to do what it always does in times of crisis, allowing the credit markets to inflate the money supply and stimulate the economy, even if it is only an economy of debt.
The longstanding outlook of this update has been that the metals will continue to move higher at a gradual pace, but that parabolic ascents will inevitably fail and cause a return to more gently sloped trendlines. The technical outlook occasionally mentioned earlier this year, which held open the possibility of a fall to $550 gold and $11 silver, was based on a more dramatic, parabolic rise in the spring. What has materialized so far instead is another possibility that has always been championed by this update, that there was simply too strong of a fundamental picture for the metals to sell off so dramatically. According to this outlook, after a period of consolidation and sideways trading, the metals bull will resume.
But this may be an oversimplification. The metals can't be held down forever, but that doesn't mean that there isn't one last blast up the sleeves of their oponents, that even from here or hereabouts there couldn't be another selloff like we saw last September. Of course, as members at TTC are fully aware, my opinion is that such an event would create the greatest buying opportunity of the decade. For now, we have to trade what we're given, and as the charts above illustrate, the metals, and really the market as a whole, are resilient in the face of mounting odds. Trading the gap between the 5-day and the 50-day can be profitable, but especially so with the help of TTC's proprietary trend cycle charts. These are only available to members, though, and if you've been thinking of joining this is the perfect time because it is the last week to get in at the current $50/month rate before fees go up. And as any member can tell you, full subscription to TTC pays for itself very quickly!
by Joe Nicholson (oroborean)
This update is provided as general information and is not an investment recommendation. TTC accepts no liability whatsoever for any losses resulting from action taken based on the contents of its charts,, commentaries, or price data. Securities and commodities markets involve inherent risk and not all positions are suitable for each individual. Check with your licensed financial advisor or broker prior to taking any action.
Joe Nicholson Archive |
© 2005-2022 http://www.MarketOracle.co.uk - The Market Oracle is a FREE Daily Financial Markets Analysis & Forecasting online publication.


