


Home Equity Extraction - Sources and uses of "free cash"
Housing-Market / Money Supply Jun 25, 2007 - 12:42 AM GMTBy: Tim_Iacono

The update to the Greenspan/Kennedy report (.pdf) on home equity extraction was a real page-turner. Seriously, it was pretty good. Economists at the Fed have once again demonstrated why they get paid the big bucks to collect data, assemble tables, and produce fifty page reports with appendices, references, and footnotes all in the proper places.
Unfortunately, as is usually the case, they didn't come to many conclusions or provide nearly enough interesting charts.
They did a great job at describing the data but seemed distracted by the "personal savings rate" question - to what extent home equity extraction may have contributed to the negative numbers that have been showing up for the last two years when the nation's spending gets subtracted from its after-tax income.
Always looking to confirm the obvious, their time would have been better spent standing outside a Circuit City querying new $2,000 plasma TV owners on their payment method and the planned disposition of the new debt just incurred. That is, was the credit card they used connected directly to their home equity line of credit or will next month's balance be paid with a future home equity withdrawal?
The report meticulously details three sources of home equity extraction - home sales, home equity loans, and cash-out refinancing - all of which contribute to what is appropriately (and ironically) termed "free cash". These are combined in the chart below showing where all the free cash went.
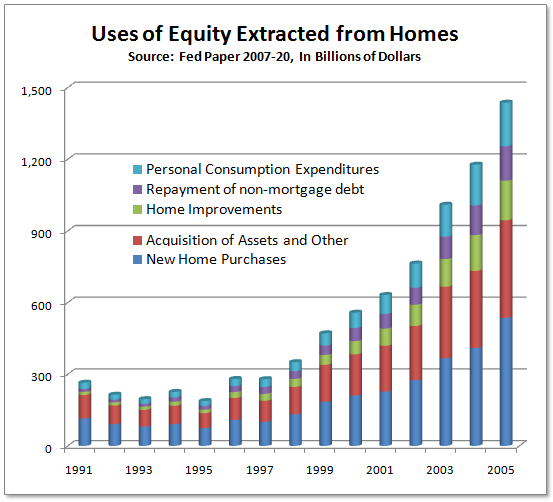
As it turns out the $1 trillion figure for "equity extraction" mentioned here yesterday was somewhat misleading in two ways. First, it understated last year's total by almost 50 percent (the $1 trillion was the five-year average). And secondly, most of this total did not go toward consumption in any direct sort of way, but rather, this money was reinvested in real estate or other assets.
Of course this ample source of a down payment money for the sellers' next home purchase (or two or three) factored greatly into the generally rising prices of recent years. The higher prices led to an overall increase in housing wealth providing additional equity against which to borrow, so it shouldn't just be ignored. But it's not as if homeowners were out spending a trillion dollars a year on plasma TVs and Escalades.
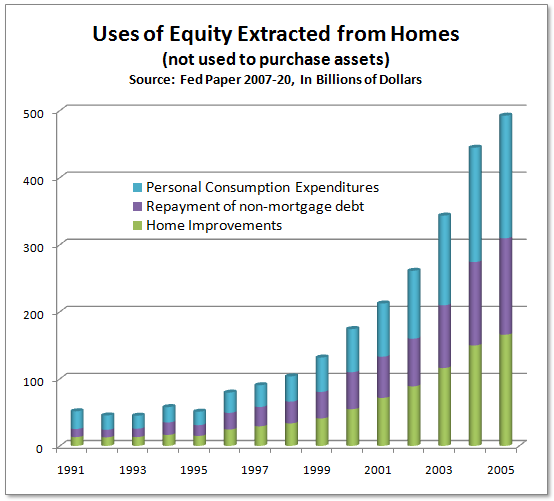
When looking at just the categories that could be considered consumption or "consumption-like", the chart below shows an eleven-fold increase in the last fifteen years whereas overall equity extraction above is only seven times the levels of the early 1990s.
That trend began reversing in 2006, but it was quite a party up until then.
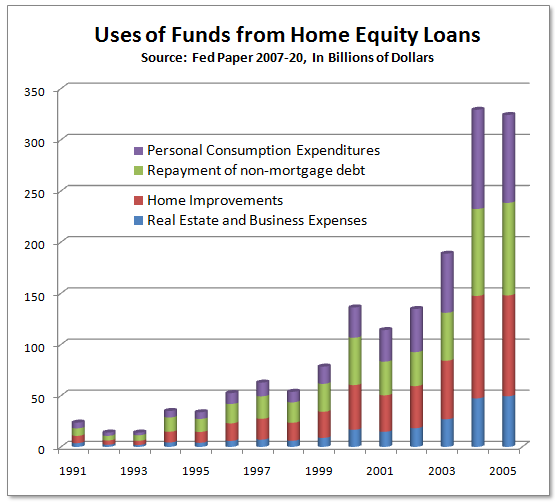
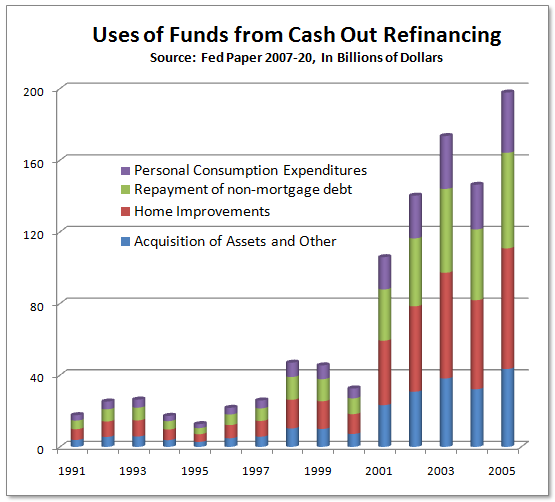
The next two charts tell the story with which everyone is now familiar - the story of the early decade real estate-induced healing after the stock market crash.
Everyone started refinancing when rates dropped like a rock in 2001.
Those were the good old days - when you could refinance, take cash out, and lower your monthly payment once a year. More often if you needed to. It was as if money was falling from the sky and the bills never came due - it really seemed like "free cash".
Remember the story about the guy who refinanced about every six months and his lender would always ask if he wanted cash back? He had no idea that the $5,000 he kept getting was being tacked onto his mortgage balance - he thought that it was a bonus that the lender was giving him for being such a good customer.
By 2004, after the waves of refinancing took hold on the consumer psyche and home prices began to soar, the serious equity withdrawal began via lines of credit and home equity loans. Never had it ever been so easy to extract money from real estate, prompting the now famous June 2005 cover of Time Magazine with the proud equity extractor hugging his home.
Having become so fixated on the shape of the curves made by the stacked bars above, little attention has been paid to the components - personal consumption, repayment of non-mortgage debt, and home improvement.
They're all pretty much equal in the charts, but when you think about it, they're all pretty much the same thing anyway.
Whether you're using the extracted equity directly to make a purchase, if you're paying off last month's credit card bill, or if you're finally getting
By Tim Iacono
Email : mailto:tim@iaconoresearch.com
http://www.iaconoresearch.com
http://themessthatgreenspanmade.blogspot.com/
Tim Iacano is an engineer by profession, with a keen understanding of human nature, his study of economics and financial markets began in earnest in the late 1990s - this is where it has led. he is self taught and self sufficient - analyst, writer, webmaster, marketer, bill-collector, and bill-payer. This is intended to be a long-term operation where the only items that will ever be offered for sale to the public are subscriptions to his service and books that he plans to write in the years ahead.
Tim Iacono Archive |
© 2005-2022 http://www.MarketOracle.co.uk - The Market Oracle is a FREE Daily Financial Markets Analysis & Forecasting online publication.