


Gold Fails to Break to New Highs, What's It Waiting For?
Commodities / Gold & Silver 2009 Sep 27, 2009 - 12:36 PM GMTBy: Merv_Burak

 The latest thrust didn’t quite make it into new all time high territory. What is it waiting for? Gaddafi talked, Ahmadinejad smiled, Chavez smelled, Obama whined and throughout it all Medvedev must have been smirking. What more is there to get gold screaming into new highs?
GOLD - LONG TERM
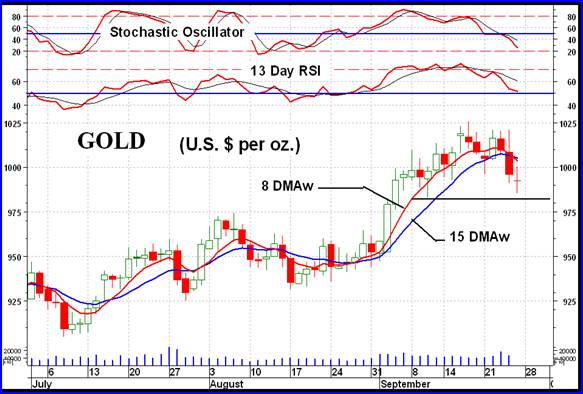
Although the week’s gold action seemed to be taking a turn for the worst it still has had no real impact upon the long term trend for gold. The long term P&F chart is still in a strong bullish trend although it has changed direction this past week and still might move lower without long term impact. The price remains above its positive sloping long term moving average line. The long term momentum indicator remains in its positive zone although it has dropped below its now negative sloping trigger line. The long term volume trend remains positive with the volume indicator above its positive sloping trigger line. Despite the weakness starting to show in the momentum indicator, to be expected during a short down price period, the rest of the indicators are still strongly positive giving us a long term rating that is BULLISH.
INTERMEDIATE TERM
We’re starting to see the same weakness coming into the intermediate term momentum indicator but as yet it is not serious. The price remains above its intermediate term positive sloping moving average line. The momentum indicator is heading lower but remains inside its positive zone. It has, however, already moved below its trigger line and the trigger has turned downward. The volume indicator is also starting to show the effects of the recent negative price moves. Although it is still positive it has dropped very slightly below its trigger line. The trigger continues to point in a positive direction. Putting it all together we still have a BULLISH rating for the intermediate term.
SHORT TERM
The short term momentum and aggressive Stochastic Oscillator had been telegraphing a short term reversal of trend over a week ago. It took hold this past week. The price is now below its short term moving average line and the line slope has turned downward. The momentum indicator, although just inside its positive zone. is moving downward and remains below its negative trigger line. The daily volume action has picked up these past couple of days of downside price action. This is usually not good. Putting the short term indicators together I get a rating of BEARISH.
As for the immediate direction of least resistance, the Stochastic Oscillator is plunging downward and is inside its negative zone below its negative trigger line. The price is below a sharply dropping very short term moving average line. There seems to be a support just above the $980 level but that support is not strong. It looks like the price may be heading towards the $925 level so I would think that the direction of least resistance would be to the down side.
SILVER
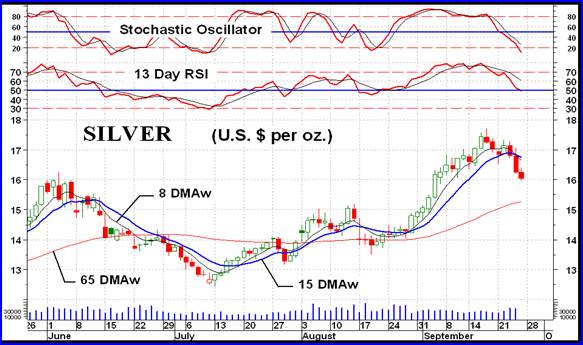
As I’ve said before “dem that goes up the fastest comes down the hardest”. So it is with silver. It has been out performing gold over the past little while but this week, with the precious metals moving lower, silver dropped far more then gold. Still nothing to worry about. The decline is, so far, of a short term duration. It remains to be seen if it will turn into something more. It could be a decline such as the one in mid-Aug or it could be a little more significant, such as the one in May. Either way, it does not yet look like it will disrupt the long term trend to any serious degree.
It’s interesting to note the actions of the short term momentum indicator (13 Day RSI) and the more aggressive Stochastic Oscillator. In both the gold and silver charts one can see the trend changing by the weakness shown in these indicators. While the price was moving into new high territory the momentum indicators were warning of weakness. Both indicators for both metals refused to make new highs and broke below their Mid-Sept lows almost right at the top of the price move. Now, both of these momentum type indicators are short term indicators. They DO NOT portent to show long term weakness or trends. One would then have to go to the intermediate or longer term indicators for that information. However, these indicators are very often excellent indicators of short term tops and bottoms.
With only some slight differences the gold and silver indicators are very much similar and giving us the same story as far as the ratings are concerned. I’ve gone into the gold analysis above. This basically applies to silver also. Therefore, the long and intermediate term ratings remain BULLISH while the short term rating is now BEARISH.
PRECIOUS METAL STOCKS
I showed the chart of the Merv’s Penny Arcade Index last week. It was once more the best performer of the North American Indices with a loss of only 0.7% versus anywhere from 4% to 7% for most of the other Indices. Have faith, this to me suggests that the bull market is not yet over even though there may be a period of downside pressure. This penny stock Index dropped 87% during its bear market from April 2007 to its bottom in Nov 2008. Now, since its bottom, the pennies have, on the AVERAGE, increased by 560% to Friday’s close. The action looks like there is still much more ahead. Speculators still seem to have a bullish attitude towards gold and silver speculation, and that’s not bearish for the precious metals in general.
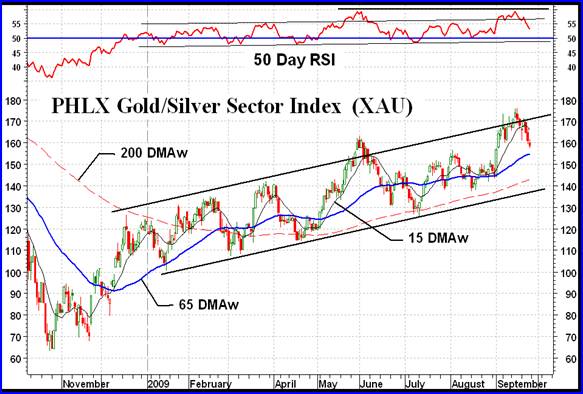
As a comparison to the pennies, the PHLX Gold/Silver Sector Index, probably the most followed of the North American “quality” stock Indices, reached its top in May of 2008 and fell only 70% before reaching its low in Oct of 2008. It has since climbed 150% to Friday’s close. Not too shabby for the top quality stocks. They usually do not have the same spectacular performance that the cats and dogs may have, when they move.
As the Table of Precious Metals Indices shows, although the short term is in a down trend the intermediate and long term are still bullish (POS). I would not be surprised to see the intermediate term also go bearish but in the end the long term bull should keep on trucking, at least from today’s view.
MERV’S PRECIOUS METALS INDICES TABLE
Well, that’s it for another week.
By Merv Burak, CMT
Hudson Aero/Systems Inc.
Technical Information Group
for Merv's Precious Metals Central
For DAILY Uranium stock commentary and WEEKLY Uranium market update check out my new Technically Uranium with Merv blog at http://techuranium.blogspot.com .
During the day Merv practices his engineering profession as a Consulting Aerospace Engineer. Once the sun goes down and night descends upon the earth Merv dons his other hat as a Chartered Market Technician ( CMT ) and tries to decipher what's going on in the securities markets. As an underground surveyor in the gold mines of Canada 's Northwest Territories in his youth, Merv has a soft spot for the gold industry and has developed several Gold Indices reflecting different aspects of the industry. As a basically lazy individual Merv's driving focus is to KEEP IT SIMPLE .
To find out more about Merv's various Gold Indices and component stocks, please visit http://preciousmetalscentral.com . There you will find samples of the Indices and their component stocks plus other publications of interest to gold investors.
Before you invest, Always check your market timing with a Qualified Professional Market Technician
Merv Burak Archive |
© 2005-2022 http://www.MarketOracle.co.uk - The Market Oracle is a FREE Daily Financial Markets Analysis & Forecasting online publication.