GOLD Downtrend Continues To Target $600
Commodities / Gold & Silver Jun 27, 2007 - 01:12 AM GMTBy: Nadeem_Walayat
Two months have passed since the last gold analysis was posted Gold Forecast Elliott Wave Analysis of Gold - A Word of Caution for Gold Bulls , which implied an imminent 5th wave peak and trend towards $600.
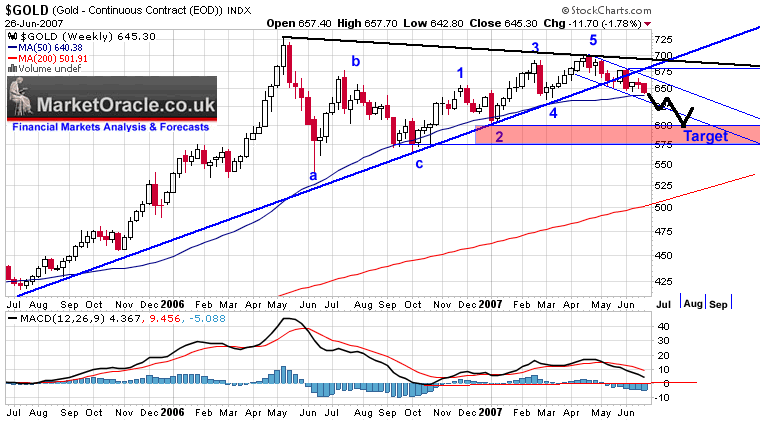
Now two months on, Gold did make the high just shy of $700 at $698 since which gold has followed a shallow trend lower. Even though Gold broke the major uptrend line in mid May 07, the trend to date continues to be of a corrective nature. Which means that despite being in an immediate downtrend, the long-term gold bull market remains intact. Now gold bulls should NOT take that statement to imply its safe to buy gold today, as you do not buy a falling market!

The above chart shows that gold is weak, and is clearly trending lower towards more significant support. This trend is expected to continue until it starts to test the significant support levels around $600. At the current close of $646, that implies another $45ish off the price of Gold over the next 6 to 8 weeks.
The downtrend line off of the recent $698 high is expected to contain corrections to the upside, currently at $670. The wide channel between between $670 and $640 gives enough room to confuse gold analysts in thinking that a bottom is in, each time gold makes a sharp reaction to the upside, only to be again disappointed on failure to clear a preceding high. Which is the real clue to a reversal in in the current downtrend.
For gold to resume the bull market as of this date, it would need to clear $666, with confirmation on break of more significant resistance at $680, any attempt at trying to buy the bottom is likely to be met with failure.
To keep things simple, I have penciled in a rough road map of how I envisage the gold price to unravel over the coming two months, which is pretty much in line with the expectations as of late April. Though I am expecting the trend to gather momentum as it moves closer to $600 and become more volatile, hence a break below the lower channel line.
The MACD (lower chart) continues to confirm the overall bearish picture, with a dip below 0 to be met with fresh wave of selling in line with expectations of an accelerating downtrend, and necessary to reduce the high degree of bullish sentiment that persists.
The risks to the forecast trend towards $600 is a breakout to the upside above the last high as measured on the weekly chart. A breakout would change the nature of the current corrective downtrend and signal base building as a prelude to the resumption of the bull market.
In summary, gold is in a corrective downtrend and continues to target $600, to be reached within the next 6 weeks. Watch for earlier triggers for a reversal to the upside on a break of the last high made during the downtrend.
By Nadeem Walayat
(c) Marketoracle.co.uk 2005-07. All rights reserved.
The Market Oracle is a FREE Daily Financial Markets Forecasting & Analysis online publication. We present in-depth analysis from over 100 experienced analysts on a range of views of the probable direction of the financial markets. Thus enabling our readers to arrive at an informed opinion on future market direction. http://www.marketoracle.co.uk
Nadeem Walayat Archive |
© 2005-2022 http://www.MarketOracle.co.uk - The Market Oracle is a FREE Daily Financial Markets Analysis & Forecasting online publication.


