


The Triple Breakout in Gold and Natural Gas
Commodities / Commodities Trading Sep 30, 2009 - 08:34 PM GMTBy: Chris_Vermeulen

 We have been waiting for gold to breakout above the 2008 high for almost 2 years. These charts show we are slowly working our way there.
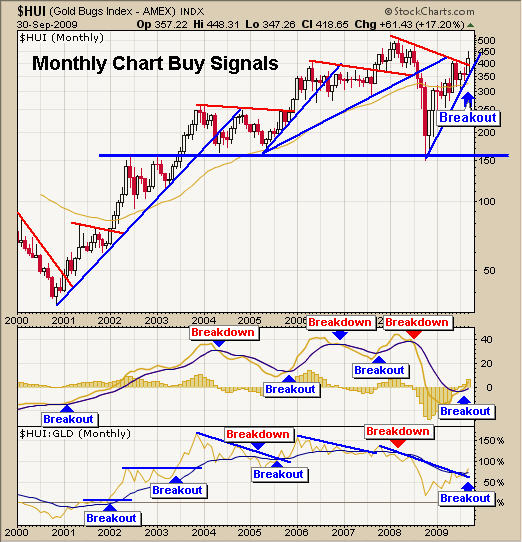
Gold Stocks Index – The Leading Indicator for Gold Bullion
I watch the price of gold stocks very closely because when there is large divergence from the price action of gold bullion I can get in a trade before the general public does.
Tuesday we saw gold stocks put in a powerful rally yet gold bullion did not move much. This told me there was going to be some positive action Wednesday in gold and there was a very nice rally, indeed.
This monthly chart of gold stocks shows a monthly breakout which is exciting to see. Most rallies last between 3-6 months on a breakout like this. That being said we could still have another 1-3 months of sideways price action as gold bullion tries to clear out the over head supply.
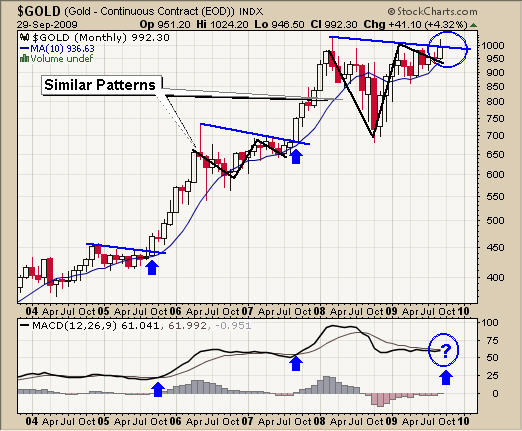
Gold Trading Breakout Signal
Gold Bullion – Monthly Timing Chart
The gold chart clearly shows that we are near a major breakout. You can also see the similar price action before the last major breakout which is encouraging.
Gold Breakout Trading Newsletter
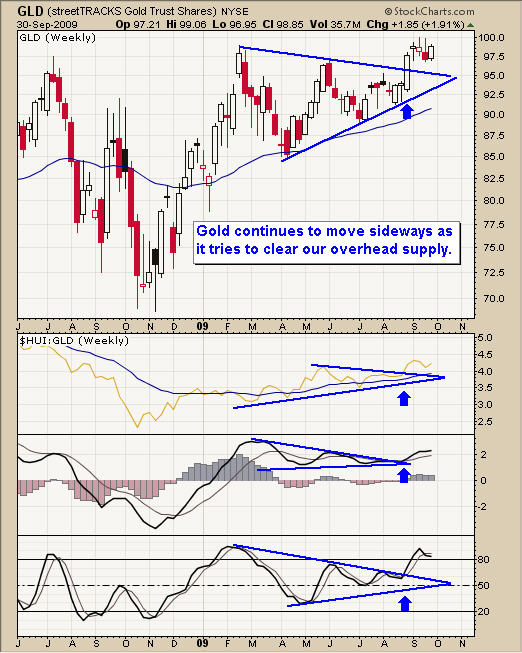
GLD Gold Bullion Trust – Weekly Timing Chart
Gold has broken out of is bullish pennant and now trying to break through the overhead resistance. So far the price action is strong but do not expect a breakout instantly. The market always has a way of dragging things out much longer than one may anticipate.
Gold Bullion Trading Breakout
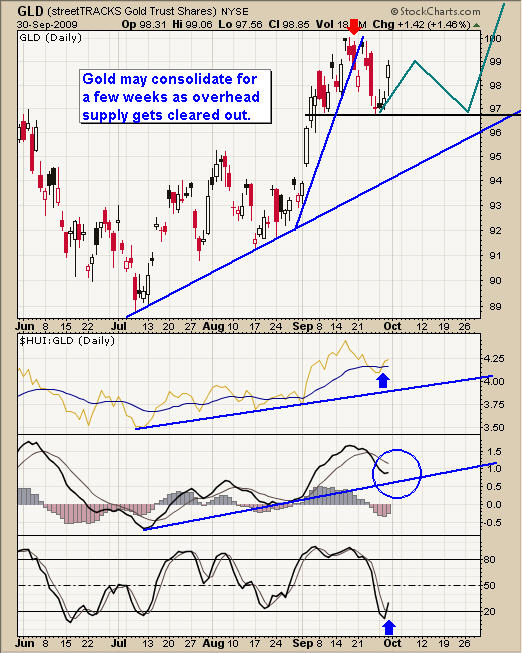
GLD Gold Bullion ETF – Daily Timing Chart
The daily chart clearly shows that if we continue to form a bull flag or some type of pennant formation it major breakout could takes weeks from here.
Gold ETF Breakout Trading
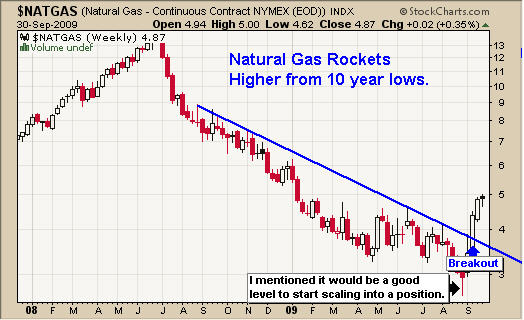
Natural Gas – Weekly Timing Chart
Several weeks’ back I pointed out that Natural Gas was extremely over sold and at 10 year lows which was a good point to start scaling into a position. This high risk setup has paid off well for those following actively trading the over bought and over sold conditions with me.
We now have a breakout and are waiting for a low risk entry point to buy more natural gas.
Natural Gas Breakout Signal Trading
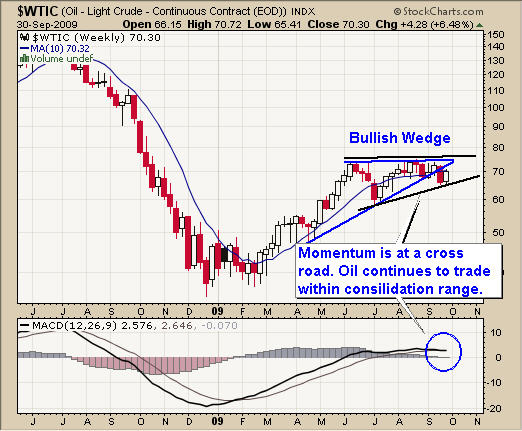
Crude Oil – Weekly Timing Chart
Crude oil continues to trade within a set of bull wedges making it difficult to get a low risk setup. I trade over bought, over sold and trends, not sideways/trend less investments which USO has been in my eyes for a few months.
Soon enough it will flash a buy or sell signal for me and we will be active again with USO and other oil funds.
Crude Oil Bull Market Trading
Weekly Market Timing Conclusion:
Overall our precious metal stocks and bullion trades are doing well. We continue to wait for a breakout, hopefully to the upside, but have protection stops in place to lock in gains if prices drop on us.
The energy sector has been tricky because oil is trend less and natural gas has gone straight up. Again my focus is on low risk, high probability trades and I don’t chase or make trades when there is nothing to trade.
If you would like to receive my Free Weekly Trading Reports like this please visit my website: www.TheGoldAndOilGuy.com
To Your Financial Success,
By Chris Vermeulen
Chris@TheGoldAndOilGuy.com
Please visit my website for more information. http://www.TheGoldAndOilGuy.com
Chris Vermeulen is Founder of the popular trading site TheGoldAndOilGuy.com. There he shares his highly successful, low-risk trading method. For 6 years Chris has been a leader in teaching others to skillfully trade in gold, oil, and silver in both bull and bear markets. Subscribers to his service depend on Chris' uniquely consistent investment opportunities that carry exceptionally low risk and high return.
This article is intended solely for information purposes. The opinions are those of the author only. Please conduct further research and consult your financial advisor before making any investment/trading decision. No responsibility can be accepted for losses that may result as a consequence of trading on the basis of this analysis.
Chris Vermeulen Archive |
© 2005-2022 http://www.MarketOracle.co.uk - The Market Oracle is a FREE Daily Financial Markets Analysis & Forecasting online publication.