Stock Market Correction Warning
Stock-Markets / Stock Index Trading Oct 02, 2009 - 11:58 AM GMT Mike Burnick writes: As the Director of Research and Client Communications at Weiss Capital Managemen, I write a weekly e-newsletter, Weiss Advice. Recently, I cautioned our readers that the month of September is historically one of the cruelest for stock market investors. However, this year, the market sailed higher in September, posting its seventh-straight monthly gain since March.
The question on everyone’s mind now is what comes next? Let’s take a closer look at this rally within the context of others … and consider what signals could indicate a shift in direction.
In a recent article, I said “for every action, there is an equal and opposite reaction.” This is a physical law of the universe, which also applies to financial markets.
Some investors call this “reversion to the mean,” which, simply stated, means that extreme market moves in one direction are often followed by equally extreme moves in the opposite direction.
The great bear market of 2007-08, followed by this year’s robust bullish bounce, is a perfect case in point.
So, it follows that one camp of analysts warns of how “overbought” stocks are and we agree. Recently, the S&P 500 Index traded about 20% above its 200-day moving average of prices — the first time that’s happened in nearly 30 years … since 1983 to be exact.1
The sheer magnitude of this rebound has been extraordinary and the perception that stocks have extended a long way above average is realistic, but consider the extraordinary depths from which they came …
The Most Extreme Market Swing in Over 70 Years
After the Lehman bankruptcy and other high-profile financial failures in the fall of 2008, the S&P 500 closed almost 40% BELOW its 200-day moving average in November.2
The last time the market fell by that amount was during the Great Depression — over 70-years ago! In a sense, we’ve come full circle. An extreme market panic decline from November 2008 to March 2009 … followed by an equally extreme rally phase since then. All of this occurred within the span of about 200 days … a remarkably swift reversal of fortune!
Just take a look at the chart below for a long-term perspective and you’ll see that such extreme volatility is indeed a rare event.
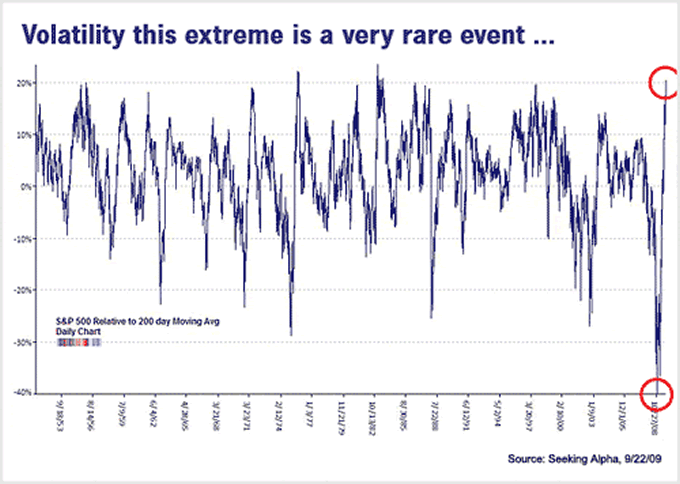
In fact, since 1950, there have been only 13 times when stocks reached such over-bought levels … a small number of occasions over the past half century. There are even fewer instances when stocks sold off to such extreme levels as they did last year.3
Now, you may be thinking, “that’s an interesting history lesson, but more important, what does it tell us about market conditions today?” Well, with history as our guide, we could be in for at least a near-term correction in the present rally.
A Pause That Refreshes?
The recent economic contraction has been dubbed “The Great Recession.” That’s because, while the data hasn’t been quite as bleak as the original Great Depression, in many ways it has been the most severe contraction to impact our economy since the 1930s.
Another severe slump occurred in the mid 1970s — after the Arab oil embargo sent inflation soaring into the double digits.
This triggered a severe bear market in 1973-74, when the S&P 500 plunged more than -44% peak-to-trough … similar to the decline from the 2007 peak to the March low this year. Then in a quick about face, stocks soared +54% higher in just nine months … again, similar to the current rally.4
What happened next?
In 1975, over-bought stock market conditions finally gave way to a correction of about -15%. This proved to be only a corrective pause that refreshed the market for further gains in 1976, but the good times didn’t last. Another bear market was just around the corner, which took the S&P down about -20% in 1977.5
The message from this market history lesson: Extreme moves in stocks can frequently produce extreme, and often unexpected, moves in the opposite direction.
Stocks don’t just move up — or DOWN — in a straight line so, at the least, a good dose of caution is warranted after the huge rally.
The Here and Now — Three Caution Flags Waving
When the gild comes off this government-induced financial rebound, markets are likely to pause at the least, and at worst, plunge.
The S&P 500 sits about 55% above its March low. Stocks are extremely over-bought, as measured by the huge gap between the index and its 200-day moving average, as well as a host of other technical indicators we follow at Weiss.
Stocks have also regained nearly HALF the value lost since the October 2007 high, when the bear market truly began. This is very similar to the magnitude and duration of the sell off and rebound rally of 1973-74.
So, if we continue to follow this “script,” then it’s reasonable to expect that a correction of -15% to -20% may occur at any time. What could signal such a decline?
Here are a few of the yellow caution flags I’m on the lookout for right now:
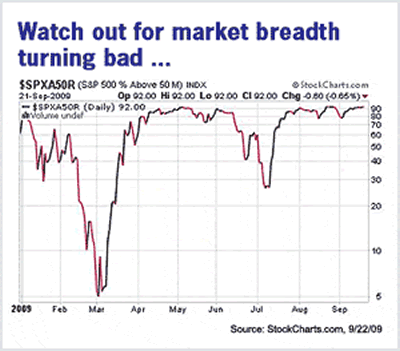 |
Caution Flag #1. Market Breadth: So far, this rally HAS been confirmed by numerous advancing stocks, with an expanding number of new highs compared to shares that are lagging, but keep a sharp eye out for a reversal.
Here’s a key indicator to watch: Since early August, over 90% of S&P 500 stocks have been trading above their 50-day moving averages. That’s over-bought, but such conditions can persist longer than you might expect.6
On the other hand, if this number begins to fall rapidly … below 80% or 70% … it could signal the beginning of a correction … which is exactly what happened in June and July of this year!
 |
Caution Flag #2. Market Sentiment: The Investors Intelligence survey shows bullish sentiment at nearly 50%, while the number of bears in hibernation has fallen to just over 24%.7
That’s a 2-to-1 ratio of bulls over bears, which is considered a negative sentiment signal from a contrarian perspective. That’s because, if the majority of investors are already bullish, then who’s left to buy?
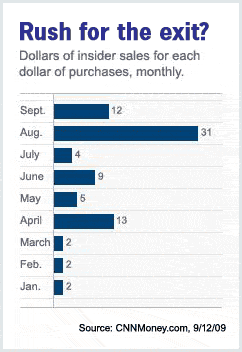
Not corporate executives, that’s for sure. In fact, insiders at American companies are SELLING stocks like there’s no tomorrow — cashing in on the market’s big rally this summer. In August alone there were $31 worth of insider stock SALES for every $1 of insider buying … a huge disparity.8
As one wise market researcher says: “Insiders know better than you and me. If prices are too high, they sell.”9
Caution Flag #3. Market Leadership: Since the rally began, two market segments in particular have really taken-off and have led the broad market higher … China and Technology.
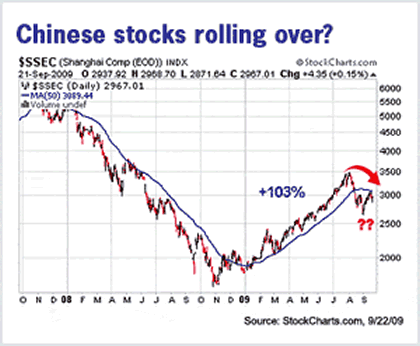 |
Chinese stocks actually bottomed in November 2008, about five months ahead of the S&P 500 Index. The reason: Fiscal and monetary stimulus efforts were unleashed in China with full force last year … while a lame-duck Congress in the U.S. argued over similar measures.
The result: China’s mainland Shanghai Composite Index soared over +100% from November to August … BUT since then, shares suffered a decline of -23% in just four weeks.10
In recent weeks, Shanghai shares have bounced back, but the near-term trend is still unclear. Further declines in Chinese shares could be a BIG red flag for our markets too.
Likewise, technology has been one of the BEST performing U.S. stock sectors since the rally began in March 2009. In fact, technology shares hit only marginal new lows in March — just slightly lower than November 2008 — outperforming most other groups.
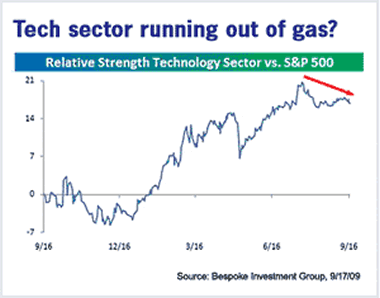 |
But since late July, while the S&P 500 surged +12% higher, tech stocks gained only +8%.11
This drop in relative strength for tech stocks compared to the broad market is yet another caution flag to keep an eye on.
At Weiss Capital Management, our investment team is closely monitoring these three caution flags, along with many other indicators, as we move into the fourth quarter.
Should any of our indicators deteriorate further, it would be a signal that a correction could be imminent.
After such an historic rally, we would not be surprised to see a correction of 15% to 20% … which would take the S&P 500 Index down to the 850 to 900 range. Like the rest of us, we’ll have to wait to see what actually unfolds.
To stay updated on our latest insight and analysis every week from Weiss Capital Management, I invite you to sign up for a complimentary subscription to our weekly e-newsletter, Weiss Advice.
Good investing,
Mike Burnick Director of Research and Client Communications
†Weiss Capital Management (an SEC-Registered Investment Adviser) is a separate but affiliated entity of Weiss Research, the publisher of Money and Markets. Both entities are owned by Weiss Group, LLC. Weiss Advice is a publication of Weiss Capital Management.
The preceding editorial may contain forward-looking statements regarding intent and belief with regard to Weiss managed strategies and the market in general. Readers are cautioned that actual results may differ materially from those statements.
1 Seeking Alpha: Unprecedented 200 Day Moving Average Swing: What Next?, 9/22/09
2 Ibid
3 Ibid
4 Bloomberg data, 9/22/09
5 Ibid
6 StockCharts.com, 9/22/09
7 Market Harmonics: Investors Intelligence Survey, 9/22/09
8 CNNMoney.com: Insiders sell like there’s no tomorrow, 9/12/09
9 Ibid
10 Bloomberg data, 9/23/09
11 Bespoke Investment Group: Is the Tech Sector Running Out of Gas?, 9/17/09
This investment news is brought to you by Money and Markets . Money and Markets is a free daily investment newsletter from Martin D. Weiss and Weiss Research analysts offering the latest investing news and financial insights for the stock market, including tips and advice on investing in gold, energy and oil. Dr. Weiss is a leader in the fields of investing, interest rates, financial safety and economic forecasting. To view archives or subscribe, visit http://www.moneyandmarkets.com .
Money and Markets Archive |
© 2005-2022 http://www.MarketOracle.co.uk - The Market Oracle is a FREE Daily Financial Markets Analysis & Forecasting online publication.


