Gold Needs to Hold Important Support
Commodities / Gold & Silver 2009 Oct 04, 2009 - 03:31 PM GMT Gold - Gold had a good week, gaining $12.10 (+1.22%) to close at $1003.00 for a weekly gain of +1.22%. So far this year gold is up 13.7%.
The daily chart below shows GLD testing its recent breakout above the June high, as marked by the dotted horizontal support line. Gold has already tested this level previously and bounced higher.
This support area needs to hold or a move lower to test the August high is likely. Just below the August high is the diagonal trend line that forms the top of the symmetrical triangle GLD has constructed since March.
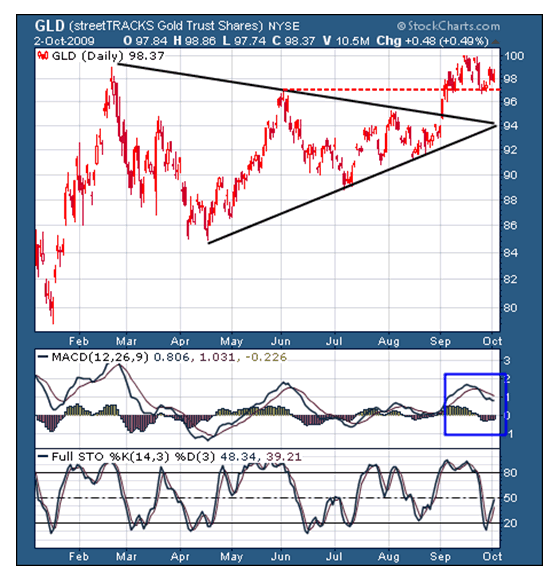
MACD remains under a negative crossover, which has widened slightly; however, the histograms are slowly receding – so the signals are mixed. Stochastics are moving higher.
The weight of the evidence slightly favors the bulls. The key is that price holds horizontal support.
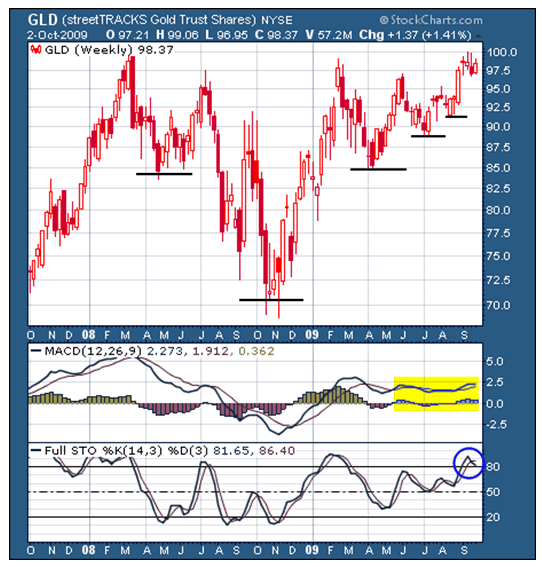
The weekly chart has the inverse head & shoulders formation still in play. The series of higher lows following the right shoulder is impressive.
Note that MACD has been trending sideways since April, which is when the right shoulder was formed. There have been a couple of negative crossovers followed by positive crossovers, yet the overall trend for MACD is sideways.
Presently, MACD looks like it is curling over and getting ready to make a negative crossover. The histograms are receding back towards zero, suggesting the same. Stochastics have already made a negative crossover, but they have not yet fallen below the 80 overbought level.
The weekly chart suggests further downside action may be coming. Price is the final arbiter, however, so watch and see if GLD holds support. That is the first objective. If support holds, higher prices will follow.
If support does not hold, then a test of the lower diagonal trend line is likely. This is around 94, which is just above the two higher lows marked on the chart following the right shoulder.
The dollar warrants close attention. If a short covering rally occurs, it could be violent, as there are many players presently short.
If (?) this were to occur it would put a strong head wind in the face of gold; and could precipitate a test of the right shoulder.
Gold Stocks
Gold stocks, as represented by the GDX, were down slightly for the week, giving back 0.31 (-0.72%) to close at 42.76.
Price has broken below its horizontal trend line connecting back to the June high. What was support has now turned into resistance and the GDX has tested the resistance zone and failed thus far.
Volume increased on the decline. MACD remains under a negative crossover, which is widening. It appears that a test of the August high (yellow band) may be forthcoming.
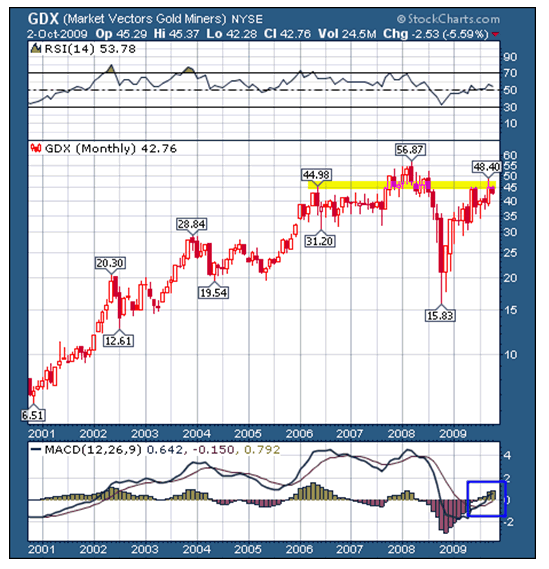
Up next is the monthly GDX chart. It shows a positive MACD crossover, which is a bullish long term signal. Notice, however, that price is near the same level it was back in 2006.
I have mentioned this before as a sign that overall the gold stocks have been underperforming physical gold; although at certain times they outperform, which is the time to be holding them.
At some point they are going to be excellent performers again – I just don’t know when. They are subject to overall stock market risk, which is considerable at this time. Thus I remain cautious.
The above excerpt is a small sampling from the latest full-length market wrap report, available only at the Honest Money Gold & Silver Report website. All major markets are covered with the emphasis on the precious metals. Stop by and check out the myriad forms of information available, not only on investing, but on the history of gold and silver money as mandated by the U.S. Constitution.
Good luck. Good trading. Good health, and that’s a wrap.

Come visit our website: Honest Money Gold & Silver Report
New Audio-Book Now Available - Honest Money
Douglas V. Gnazzo
Honest Money Gold & Silver Report
About the author: Douglas V. Gnazzo writes for numerous websites and his work appears both here and abroad. Mr. Gnazzo is a listed scholar for the Foundation for the Advancement of Monetary Education (FAME).
Disclaimer: The contents of this article represent the opinions of Douglas V. Gnazzo. Nothing contained herein is intended as investment advice or recommendations for specific investment decisions, and you should not rely on it as such. Douglas V. Gnazzo is not a registered investment advisor. Information and analysis above are derived from sources and using methods believed to be reliable, but Douglas. V. Gnazzo cannot accept responsibility for any trading losses you may incur as a result of your reliance on this analysis and will not be held liable for the consequence of reliance upon any opinion or statement contained herein or any omission. Individuals should consult with their broker and personal financial advisors before engaging in any trading activities. Do your own due diligence regarding personal investment decisions. This article may contain information that is confidential and/or protected by law. The purpose of this article is intended to be used as an educational discussion of the issues involved. Douglas V. Gnazzo is not a lawyer or a legal scholar. Information and analysis derived from the quoted sources are believed to be reliable and are offered in good faith. Only a highly trained and certified and registered legal professional should be regarded as an authority on the issues involved; and all those seeking such an authoritative opinion should do their own due diligence and seek out the advice of a legal professional. Lastly Douglas V. Gnazzo believes that The United States of America is the greatest country on Earth, but that it can yet become greater. This article is written to help facilitate that greater becoming. God Bless America.
Douglas V. Gnazzo © 2009 All Rights Reserved
© 2005-2022 http://www.MarketOracle.co.uk - The Market Oracle is a FREE Daily Financial Markets Analysis & Forecasting online publication.


